Imaging Software
Last updated on 2026-06-09 | Edit this page
Overview
Questions
- What are the different software options for viewing microscopy images?
- How can Napari be used to view images?
Objectives
- Explain the pros and cons of different image visualisation tools (e.g. ImageJ, Napari and proprietary options)
- Use Napari to open images
- Navigate the Napari viewer (pan/zoom/swapping between 2D and 3D views…)
- Explain the main parts of the Napari user interface
Choosing the right tool for the job
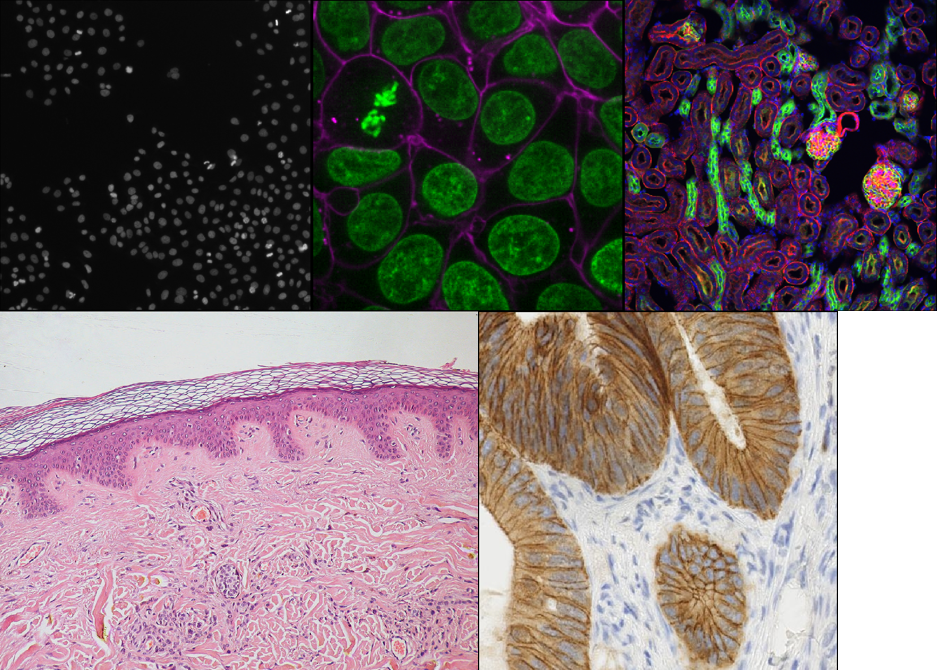
Light microscopes can produce a very wide range of image data (we’ll see some examples in the multi-dimensional images episode) - for example:
- 2D or 3D
- Time series or snapshots
- Different channels
- Small to large datasets
With such a wide range of data, there comes a huge variety of software that can work with these images. Different software may be specialised to specific types of image data, or to specific research fields. There is no one ‘right’ software to use - it’s about choosing the right tool for yourself, your data, and your research question!
Some points to consider when choosing software are:
What is common in your research field?
Having a good community around the software you work with can be extremely helpful - so it’s worth considering what is popular in your department, or in relevant papers in your field.Open source or proprietary?
We’ll look at this more in the next section, but it’s important to consider if the software you are using is freely available, or requires a one-off payment or a regular subscription fee to use.Support for image types?
For example, does it support 3D images, or timeseries?Can it be automated/customised/extended?
Can you automate certain steps with your own scripts or plugins? This is useful to make sure your analysis steps can be easily shared and reproduced by other researchers. It also enables you to add extra features to a piece of software, and automate repetitive steps for large numbers of images.
What are scripts and plugins?
Scripts and plugins are ways to automate certain software steps or add new features.
Scripts
Scripts are lists of commands to be carried out by a piece of software e.g. load an image, then threshold it, then measure its size… They are normally used to automate certain processing steps - for example, rather than having to load each image individually and click the same buttons again and again in the user interface, a script could load each image automatically and run all those steps in one go. Not only does this save time and reduce manual errors, but it also ensures your workflow can easily be shared and reproduced by other researchers.
Plugins
Plugins, in contrast to scripts, are focused on adding optional new features to a piece of software (rather than automating use of existing features). They allow members of the community, outside the main team that develops the software, to add features they need for a particular image type or processing task. They’re designed to be reusable so other members of the community can easily benefit from these new features.
A good place to look for advice on software is the image.sc forum - a popular forum for image analysis (mostly related to biological or medical images).
Using the image.sc forum
Go to the image.sc forum and take a look at the pinned post called ‘Welcome to the Image.sc Forum!’
Search for posts in the category ‘Announcements’ tagged with ‘napari’
Search for posts in the category ‘Image Analysis’ tagged with ‘napari’
Click on some posts to see how questions and replies are laid out
Open source vs proprietary
A key factor to consider when choosing software is whether it is open source or proprietary:
Open source: Software that is made freely available to use and modify.
Proprietary: Software that is owned by a company and usually requires either a one-off fee or subscription to use.
Both can be extremely useful, and it is very likely that you will use a mix of both to view and analyse your images. For example, proprietary software is often provided by the manufacturer when a microscope is purchased. You will likely use this during acquisition of your images and for some processing steps after.
There are pros and cons to both, and it’s worth considering the following:
Cost
One of the biggest advantages of open source software is that it is
free. This means it is always available, even if you move to a different
institution that may not have paid for other proprietary software.
Development funding/team
Proprietary software is usually maintained by a large team of developers
that are funded full time. This may mean it is more stable and
thoroughly tested/validated than some open-source software. Some
open-source projects will be maintained by large teams with very
thorough testing, while others will only have a single developer
part-time.
Flexibility/extension
Open-source software tends to be easier to extend with new features, and
more flexible to accommodate a wide variety of workflows. Although, many
pieces of proprietary software have a plugin system or scripting to
allow automation.
Open file formats and workflows
Open-source software uses open file formats and workflows, so anyone can
see the details of how the analysis is done. Proprietary software tends
to keep the implementation details hidden and use file formats that
can’t be opened easily in other software.
As always, the right software to use will depend on your preference, your data and your research question. This being said, we will only use open-source software in this course, and we encourage using open-source software where possible.
Fiji/ImageJ and Napari
While there are many pieces of software to choose from, two of the most popular open-source options are Fiji/ImageJ and Napari. They are both:
- Freely available
- ‘General’ imaging software i.e. applicable to many different research fields
- Supporting a wide range of image types
- Customisable with scripts + plugins
Both are great options for working with a wide variety of images - so why choose one over the other? Some of the main differences are listed below if you are interested:
Python vs Java
A big advantage of Napari is that it is made with the Python programming
language (vs Fiji/ImageJ which is made with Java). In general, this
makes it easier to extend with scripts and plugins as Python tends to be
more widely used in the research community. It also means Napari can
easily integrate with other python tools e.g. Python’s popular machine
learning libraries.
Maturity
Fiji/ImageJ has been actively developed for many years now (>20
years), while Napari is a more recent development starting
around 2018. This difference in age comes with pros and cons - in
general, it means that the core features and layout of Fiji/ImageJ are
very well established, and less likely to change than Napari. With
Napari, you will likely have to adjust your image processing workflow
with new versions, or update any scripts/plugins more often. Equally, as
Napari is new and rapidly growing in popularity, it is quickly gaining
new features and attracting a wide range of new plugin developers.
Built-in tools
Fiji/ImageJ comes with many image processing tools built-in by default -
e.g. making image histograms, thresholding and gaussian blur (we will
look at these terms in the filters and thresholding
episode). Napari, in contrast, is more minimal by default - mostly
focusing on image display. It requires installation of additional
plugins to add many of these features.
Specific plugins
There are excellent plugins available for Fiji/ImageJ and Napari that
focus on specific types of image data or processing steps. The
availability of a specific plugin will often be a deciding factor on
whether to use Fiji/ImageJ or Napari for your project.
Ease of installation and user interface
As Fiji/ImageJ has been in development for longer, it tends to be
simpler to install than Napari (especially for those with no prior
Python experience). In addition, as it has more built-in image
processing tools, it tends to be simpler to use fully from its user
interface. Napari meanwhile is often strongest when you combine it with
some Python scripting (although this isn’t required for many
workflows!)
For this lesson, we will use Napari as our software of choice. It’s worth bearing in mind though that Fiji/ImageJ can be a useful alternative - and many workflows will actually use both Fiji/ImageJ and Napari together! Again, it’s about choosing the right tool for your data and research question.
Opening Napari
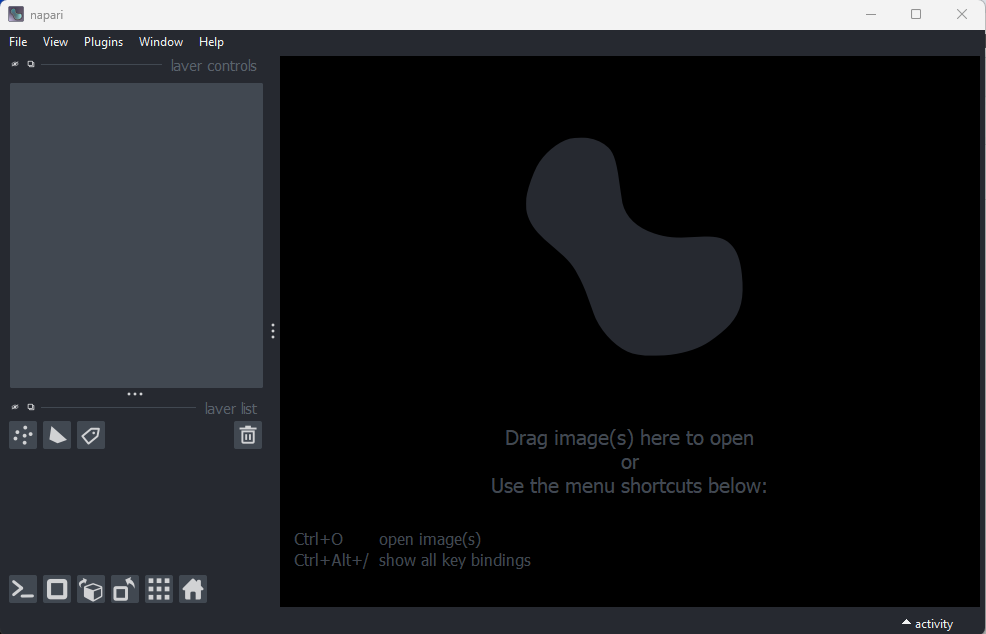
Let’s get started by opening a new Napari window - you should have already followed the installation instructions. Note this can take a while the first time, so give it a few minutes!
Opening images
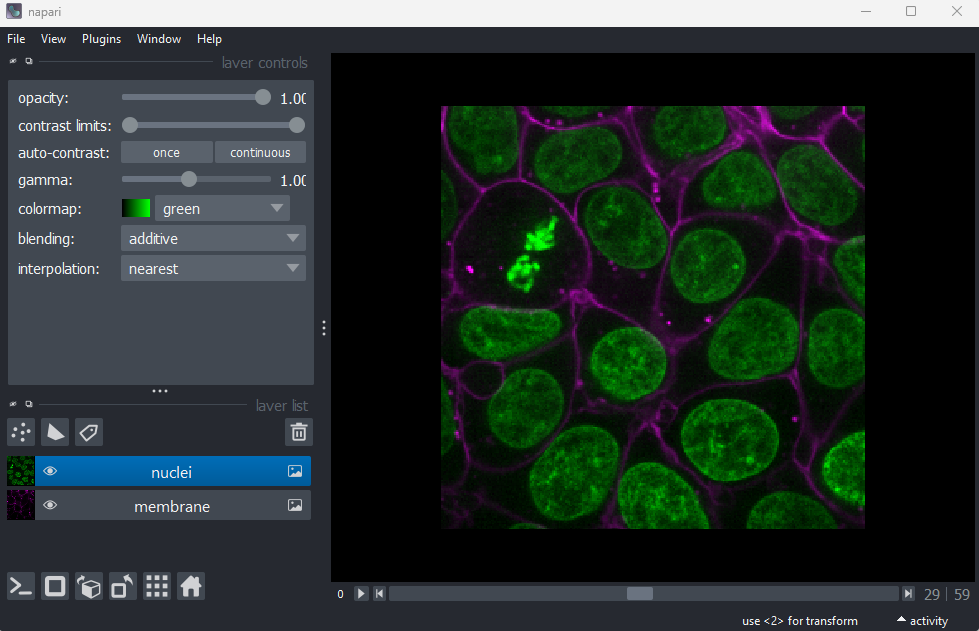
Napari comes with some example images - let’s open one now. Go to the
top menu-bar of Napari and select:File > Open Sample > napari builtins > Cells (3D+2Ch)
You should see a fluorescence microscopy image of some cells:
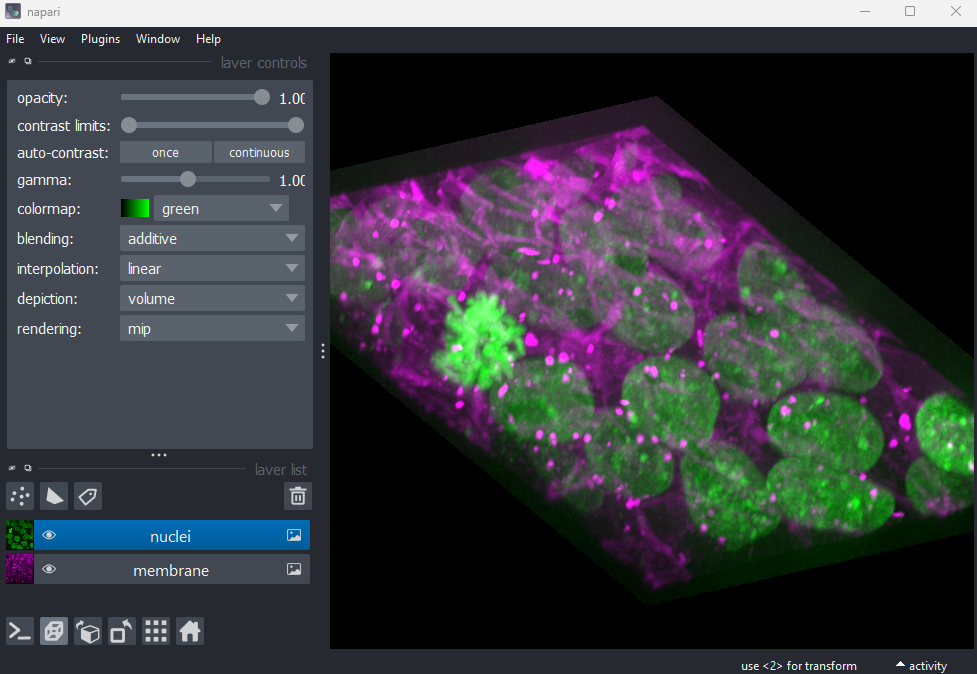
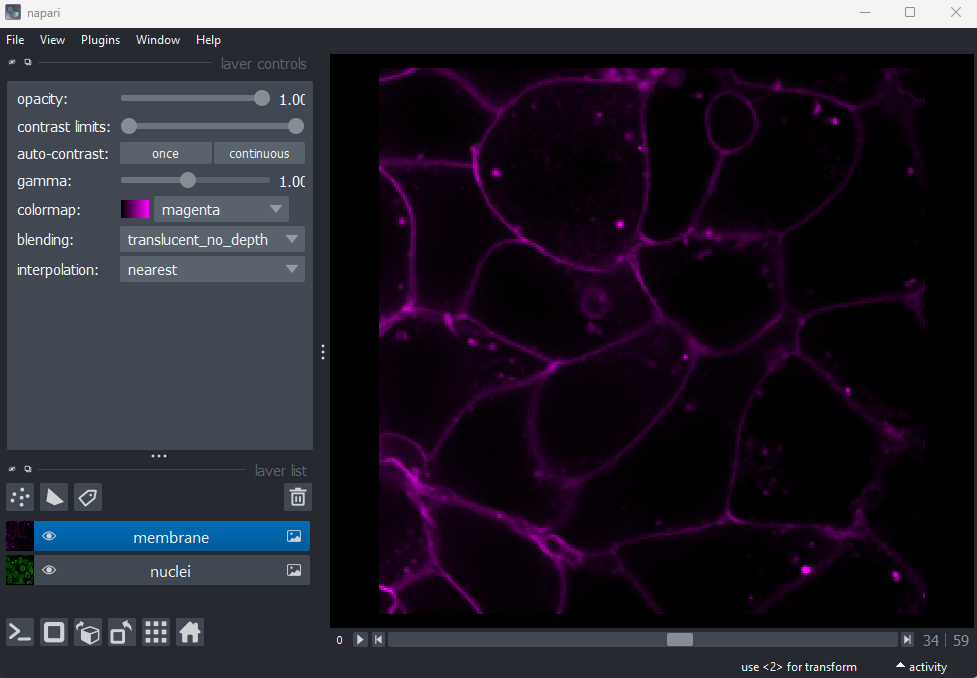
Napari’s User interface
Napari’s user interface is split into a few main sections, as you can see in the diagram below (note that on Macs the main menu will appear in the upper ribbon, rather than inside the Napari window):
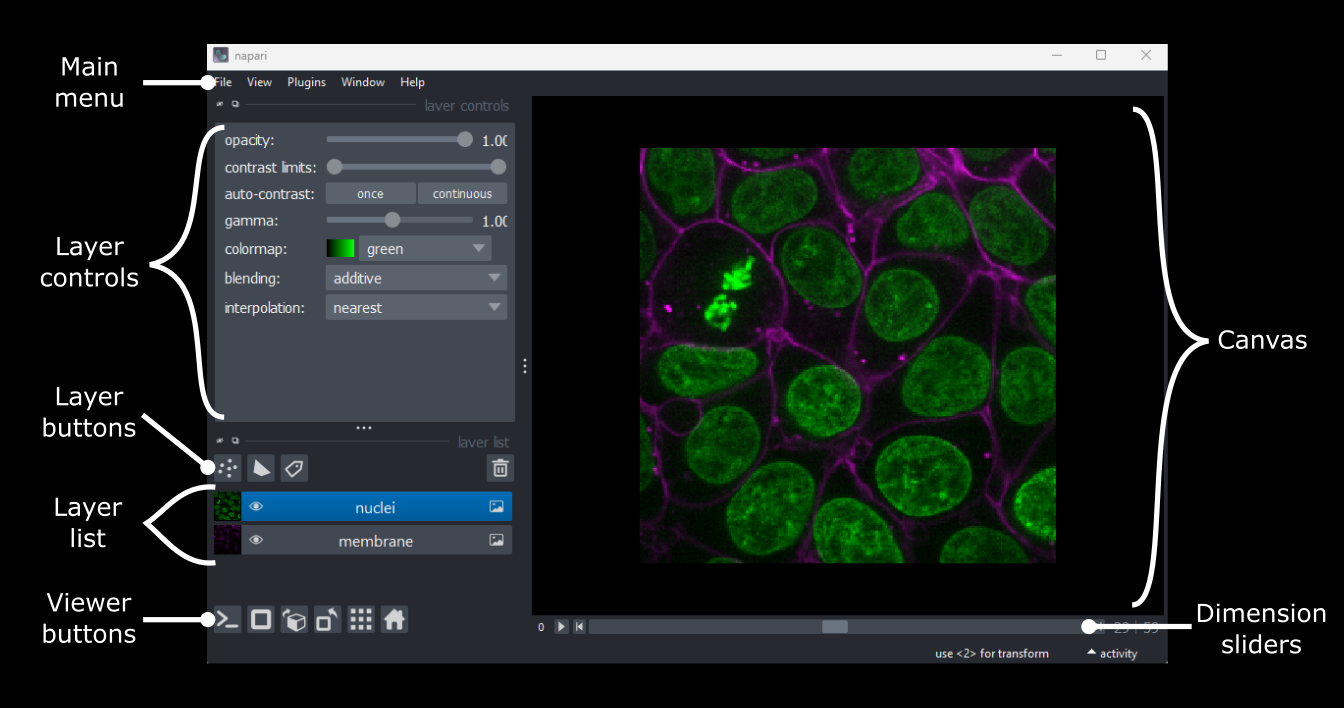
Let’s take a brief look at each of these sections - for full information see the Napari documentation.
Main menu
We already used the main menu in the last section to open a sample image. The main menu contains various commands for opening images, changing preferences and installing plugins (we’ll see more of these options in later episodes).
Canvas
The canvas is the main part of the Napari user interface. This is where we display and interact with our images.
Try moving around the cells image with the following commands:
Pan - Click and drag
Zoom - Scroll in/out (use the same gestures with your mouse
                      that you would use to scroll up/down
                      in a document)
Dimension sliders
Dimension sliders appear at the bottom of the canvas depending on the type of image displayed. For example, here we have a 3D image of some cells, which consists of a stack of 2D images. If we drag the slider at the bottom of the image, we move up and down in this stack:
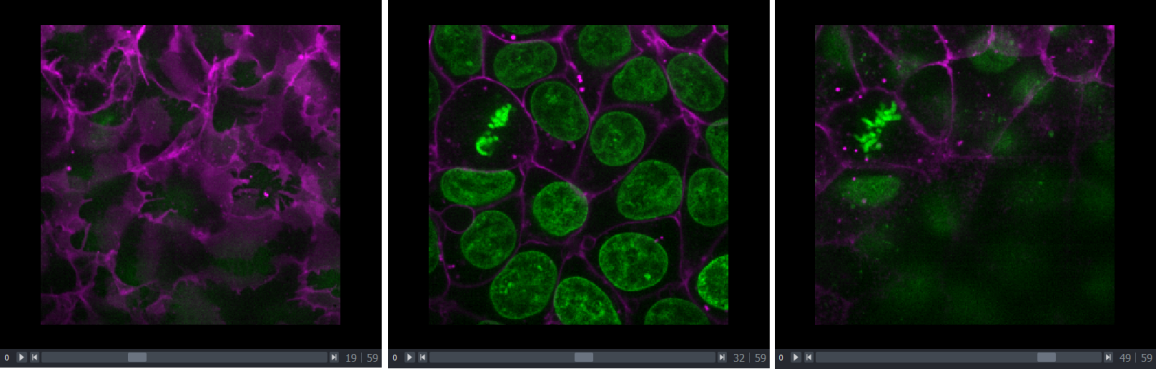
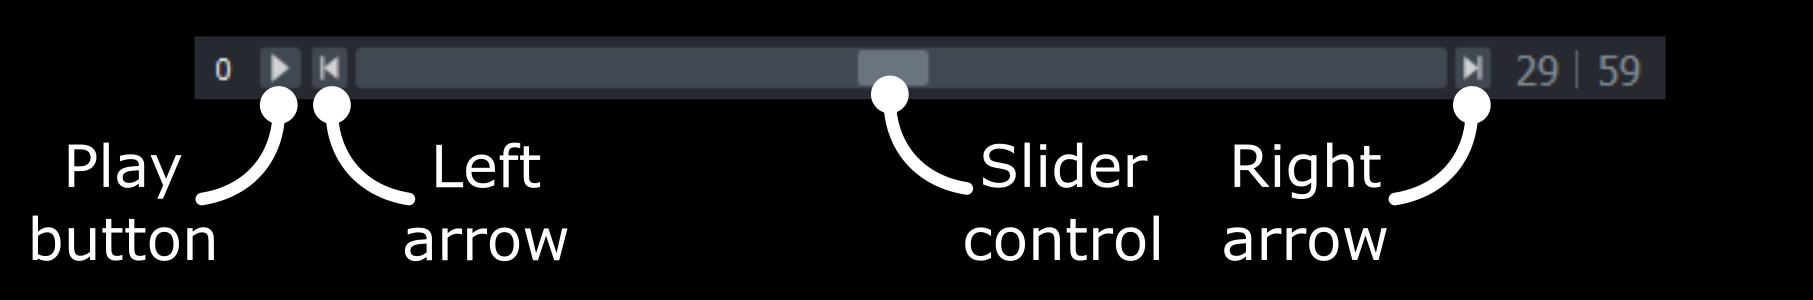
Pressing the arrow buttons at either end of the slider steps through one slice at a time. Also, pressing the ‘play’ button at the very left of the slider moves automatically through the stack until pressed again.
We will see in later episodes that more sliders can appear if our image has more dimensions (e.g. time series, or further channels).
Viewer buttons
The viewer buttons (the row of buttons at the bottom left of Napari) control various aspects of the Napari viewer:
Console 
This button opens Napari’s built-in python console - we’ll use the console more in later episodes.
2D/3D  /
/ 
This switches the canvas between 2D and 3D display. Try switching to the 3D view for the cells image:
The controls for moving in 3D are similar to those for 2D:
Rotate - Click and drag
Pan - Shift + click and drag
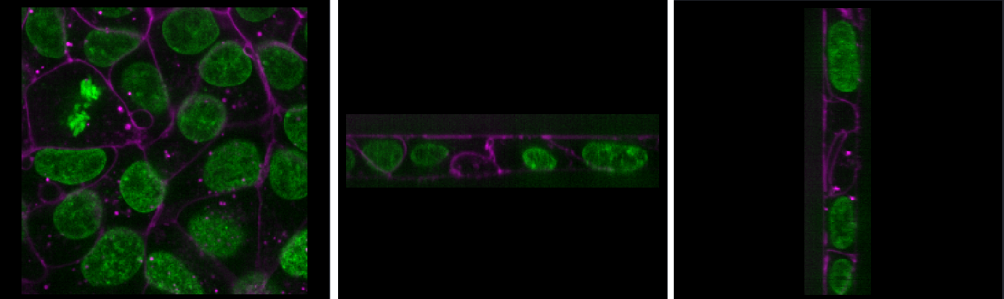
Zoom - Scroll in/outRoll dimensions 
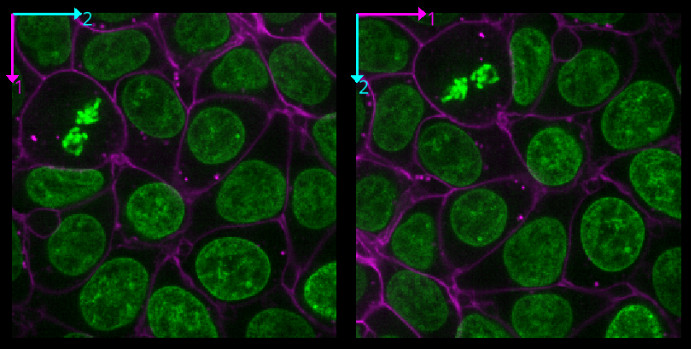
This changes which image dimensions are displayed in the viewer. For example, let’s switch back to the 2D view for our cells image and press the roll dimensions button multiple times. You’ll see that it switches between different orthogonal views (i.e. at 90 degrees to our starting view). Pressing it 3 times will bring us back to the original orientation.
Transpose dimensions 
This button swaps the two currently displayed dimensions. Again trying this for our cells image, we see that the image becomes flipped. Pressing the button again brings us back to the original orientation.
Grid 
This button displays all image layers in a grid (+ any additional layer types, as we’ll see later in the episode). Using this for our cells image, we see the nuclei (green) displayed next to the cell membranes (purple), rather than on top of each other.
Layer list
Now that we’ve seen the main controls for the viewer, let’s look at
the layer list. ‘Layers’ are how Napari displays multiple items together
in the viewer. For example, currently our layer list contains two items
- ‘nuclei’ and ‘membrane’. These are both Image layers and
are displayed in order, with the nuclei on top and membrane
underneath.
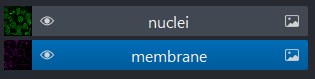
We can show/hide each layer by clicking the eye icon on the left side of their row. We can also rename them by double clicking on the row.
We can change the order of layers by dragging and dropping items in the layer list. For example, try dragging the membrane layer above the nuclei. You should see the nuclei disappear from the viewer (as they are now hidden by the membrane image on top).
Here we only have Image layers, but there are many more
types like Points, Shapes and
Labels, some of which we will see later in the episode.
Layer controls
Next let’s look at the layer controls - this area shows controls only
for the currently selected layer (i.e. the one that is highlighted in
blue in the layer list). For example, if we click on the nuclei layer
then we can see a colormap of green, while if we click on
the membrane layer we see a colormap of magenta.
Controls will also vary depending on layer type (like
Image vs Points) as we will see later in this episode.
Let’s take a quick look at some of the main image layer controls:
Opacity
This changes the opacity of the layer - lower values are more transparent. For example, reducing the opacity of the membrane layer (if it is still on top of the nuclei), allows us to see the nuclei again.
Contrast limits
We’ll discuss this in detail in the image display episode, but briefly - the contrast limits adjust what parts of the image we can see and how bright they appear in the viewer. Moving the left node adjusts what is shown as fully black, while moving the right node adjusts what is shown as fully bright.
Colormap
Again, we’ll discuss this in detail in the image display episode, but briefly - the colormap determines what colours an image is displayed with. Clicking in the dropdown shows a wide range of options that you can swap between.
Blending
This controls how multiple layers are blended together to give the final result in the viewer. There are many different options to choose from. For example, let’s put the nuclei layer back on top of the membrane and change its blending to ‘opaque’. You should see that it now completely hides the membrane layer underneath. Changing the blending back to ‘additive’ will allow both the nucleus and membrane layers to be seen together again.
Using image layer controls
Adjust the layer controls for both nuclei and membrane to give the result below:
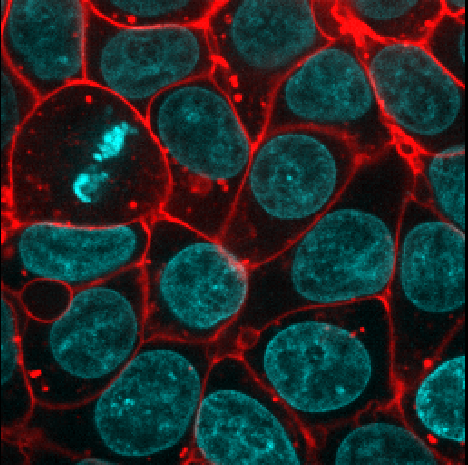
- Click on the nuclei in the layer list
- Change the colormap to cyan
- Click on the membrane in the layer list
- Change the colormap to red
- Move the right contrast limits node to the left to make the membranes appear brighter
Layer buttons
So far we have only looked at Image layers, but there
are many more types supported by Napari. The layer buttons allow us to
add additional layers of these new types:
Points 
This button creates a new points layer. This can be used to mark specific locations in an image.
Shapes 
This button creates a new shapes layer. Shapes can be used to mark regions of interest e.g. with rectangles, ellipses or lines.
Labels 
This button creates a new labels layer. This is usually used to label specific regions in an image e.g. to label individual nuclei.
Remove layer 
This button removes the currently selected layer (highlighted in blue) from the layer list.
Point layers
Let’s take a quick look at one of these new layer types - the
Points layer.
Add a new points layer by clicking the points button. Investigate the different layer controls - what do they do? Note that hovering over buttons will usually show a summary tooltip.
Add points and adjust settings to give the result below:
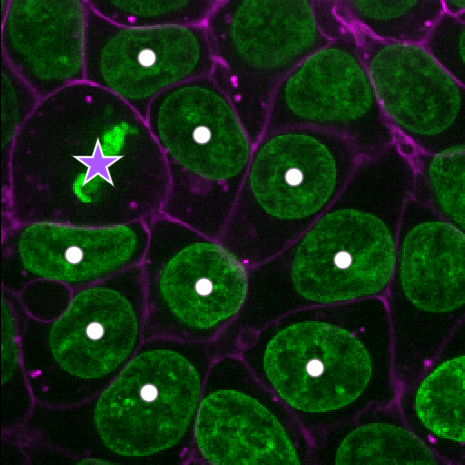
- Click the ‘add points’ button

- Click on nuclei to add points on top of them
- Click the ‘select points’ button

- Click on the point over the dividing nucleus
- Increase the point size slider
- Change its symbol to star
- Change its face colour to purple
- change its edge colour to white
- There are many software options for light microscopy images
- Napari and Fiji/ImageJ are popular open-source options
- Napari’s user interface is split into a few main sections including the canvas, layer list, layer controls…
- Layers can be of different types e.g.
Image,Point,Label - Different layer types have different layer controls