Designing a light microscopy experiment
Last updated on 2026-06-09 | Edit this page
Overview
Questions
- What are the key factors to consider when designing a light microscopy experiment?
Objectives
Explain the main steps of designing a light microscopy experiment
Describe a few examples of common microscopy methods e.g. widefield, confocal
Explain factors to consider when choosing a microscopy technique
In previous episodes we focused on the fundamentals of how images are stored and displayed, with Napari as our main example. In the next few episodes, we will instead focus on how to design an experiment using light microscopy and how to analyse the resulting image data.
Steps to designing a light microscopy experiment
As we’ve said throughout the course, there is no one ‘right’ way of analysing image data. It depends on the specific images and research question, with different solutions being best for different situations. The same holds true for designing a light microscopy experiment - here we’ll discuss some general guidelines, but the specifics will depend on your particular research project.
For the sake of this episode, let’s imagine a scenario where we are investigating the effects of a specific chemical on cells grown in culture. What steps would we take to design a light microscopy experiment for this?
A general workflow could be:
Define your research question
Define what you need to observe to answer that question
Define what you need to measure to answer that question
Choose a light microscopy method that fits your data needs
Choose acquisition settings that fit your data needs
Define your research question
Clearly defining your research question is the essential starting point. What do you want to find out from your microscopy experiment?
For our chemical example, the main aim could be: Does the chemical affect the number, size or shape of cell nuclei over time?
Then we could form more specific research questions e.g.
Does the addition of the chemical result in an increase in the number of cell nuclei over ten hours?
Does the addition of the chemical result in an increase in the average nucleus diameter over ten hours?
Does the addition of the chemical result in an increase in the roundness of cell nuclei over ten hours?
For the rest of the episode, we will stick to our very broad research aim of: ‘Does the chemical affect the number, size or shape of cell nuclei over time?’. This will allow us to have a broad discussion of many different approaches to designing a light microscopy experiment. Bear in mind that in a real experiment you should be as specific as possible with your research question!
Define what you need to observe
The next step is to figure out what you need to observe to answer your research question. For example:
What structures/events do you need to see?
Do you need fluorescent labels? If so, how many?
Over what spatial scale? E.g. large tissue sections vs small 3D volumes
Over what timescale? E.g. do you need live cell imaging to follow events over time, or is a snapshot of fixed cells enough?
2D or 3D?
What do you need to observe?
What would you need to observe to answer our research question? - ‘Does the chemical affect the number, size or shape of cell nuclei over time?’
Think about the points above and make a list of potential answers. It may be best to discuss in a group, so you can share different ideas.
Structures / events
We need to see individual nuclei, with enough resolution to see their size and overall shape.
Fluorescent labels
We will probably need a fluorescent label for the nuclei. This will allow them to be easily identified in our images so the number, size and shape can be measured.
Note that it is possible to see and measure nuclei from un-labelled cells also (e.g. from phase contrast or DIC images, as we will cover in the widefield section of this episode). The downside is that it’s much harder to automatically recognise and measure nuclei from these kinds of images. Unlike images of fluorescently labelled nuclei, there is a much less clear separation between nuclei and the rest of the cell, making analysis more challenging.
Spatial scale
We need to observe many nuclei at once, to get a good estimate of their number and average shape and size. Therefore, our spatial scale should encompass an area large enough to image many nuclei for each timepoint (say 100 nuclei).
Timescale
As we are interested in how the nuclei number, shape and size changes over time, we will need to use live cell imaging. We will need to image for long enough to see multiple cell divisions, so we can assess how the number of nuclei increases. The length of time required will depend on the cell line you are using, as they each take a different length of time to divide.
2D or 3D
This will depend on how we want to measure nucleus size and shape (as we’ll look at in the next section of this episode). For example, if we want to accurately characterise the volume and 3D shape of the nuclei then we will need to image in 3D. If we’re instead happy to estimate from 2D measures like nucleus diameter, then 2D is sufficient. This again highlights the need for a specific research question! In a real life experiment, we should probably define more clearly exactly what aspects of nucleus size and shape we are interested in, as this will help to inform the need for 2D or 3D.
Define what you need to measure
Once we have a good idea of what we need to observe, we need to clearly define what measurements are required.
What do you need to quantify from your images to answer your question? E.g. cell length, nucleus volume, the number of cells with a specific fluorescent label…
How will you quantify them? E.g. which image processing software? What kind of analysis methods?
How many objects/events do you need to quantify?
As the second point indicates, it’s always worthwhile to consider how you will quantify your images before you collect them. This will make the image analysis steps much faster and ensure that you are collecting images optimised for the given method. We’ll look at image processing methods more in later episodes.
For the last point, it’s important to consider any statistical tests you will use to answer your research question, and the sample size required to give them sufficient statistical ‘power’. Statistical power is the likelihood of a statistical test detecting an effect when one is actually present. For example, consider testing if there is a difference of X% in the number of cells when grown with and without our chemical of interest. If there really is a difference, a statistical power of 0.8 (80%) would mean that out of 100 different studies, 80 of them would detect it. Having a high statistical power is vital to ensure that our experiment has a good chance of detecting the effects we are interested in. There is a clear relationship between sample size and power, with larger sample sizes resulting in higher power to detect the same effect. Conducting a ‘power analysis’ is a good way to assess a reasonable minimum sample size for your experiment. A full discussion of this is outside of the scope of this course, but there are links to further resources in the final episode.
What do you need to measure?
Consider the two points below and make a list of potential answers for our research question ‘Does the chemical affect the number, size or shape of cell nuclei over time?’:
- What do you need to quantify from your images to answer your question?
- How will you quantify them?
It may be best to discuss in a group, so you can share different ideas.
What to quantify?
For nucleus number, we will need to count the number of nuclei present at each timepoint.
For nucleus size, there are many different options. If we’re imaging in 2D, we could measure the nucleus area, or the width at its widest point. For 3D, we could measure nucleus volume, or again the width at its widest point…
For nucleus shape, there are even more options. In 2D we could, for
example, measure the nucleus ‘roundness’ (a measure of how circular it
is). In 3D, we could measure nucleus ‘sphericity’ (a measure of how
spherical it is). Which measures you use will often depend on which
image analysis software you use. Many analysis packages have a wide
range of shape (morphological) features built-in e.g. Napari has a
plugin called ‘napari-skimage’, which provides access to scikit-image’s
regionprops. See scikit-image’s
documentation for regionprops for details on the available
features.
How to quantify?
Here again there is no one correct answer - a lot will depend on which image analysis software you use and your personal preference. For example, let’s say you decided on imaging in 3D and measuring nucleus number, volume and sphericity with Napari. Before we can make any measurements from the cells, we first need to ‘segment’ the nuclei i.e. identify which pixels in the image correspond to each nucleus (we’ll look at this in detail in later episodes). For some tasks, this could be as simple as drawing a contour or boundary around the cell. However, as we are looking to quantify many nuclei at many different timepoints, it’s not feasible to do this manually - we’ll need to develop an automated workflow to segment the nuclei and measure their volume and sphericity. We’ll look at some techniques for this kind of analysis in the manual segmentation, thresholding and instance segmentation episodes.
Choose a light microscopy method
For the final part of this episode, let’s look at how we can choose a light microscopy method for our experiment. We’ll look at the last step (choosing acquisition settings) in the next episode.
Often the first step in choosing a light microscopy technique is discussing with other members of your research group or department. What are most of them using, for what kind of experiments? If you are working with a microscopy core facility, then the people who work there are also a great source of advice and recommendations. Finally, you can also explore the literature for research questions and experiments similar to yours to see which methods are used most often.
There’s a very wide variety of light microscopes available (from many different manufacturers) that are specialised for different kinds of samples. We’ll take a brief look at some popular options below, but there are far too many to cover in a single episode. Bear this in mind when choosing light microscopy techniques for your own experiments - there are many more options to consider!
Widefield
In a widefield microscope, the entire sample is illuminated by the light source at once. The light source can illuminate the sample from below (in an upright microscope) or from above (in an inverted microscope).
In it’s simplest form, a widefield microscope can be used for ‘brightfield microscopy’. This is simply where the sample is illuminated by a bright light from one side, and then imaged from the other. The issue with this method is that it often produces low-contrast images, where it’s difficult to see biological structures. This is because biological structures are often quite transparent - they don’t absorb much light or differ much in their density. For this reason, contrast agents/staining are often used to increase contrast (i.e. the addition of dyes/chemicals that bind to specific structures).
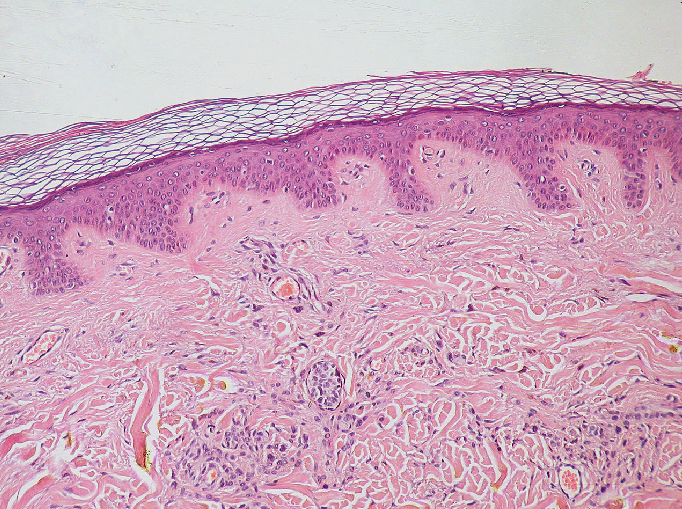
To increase contrast (especially for unstained samples), widefield microscopes often support ‘phase-contrast’ or ‘DIC - Differential Interference Contrast’. Both these methods make use of slight changes in the ‘phase’ of light as it passes through a sample to increase contrast.
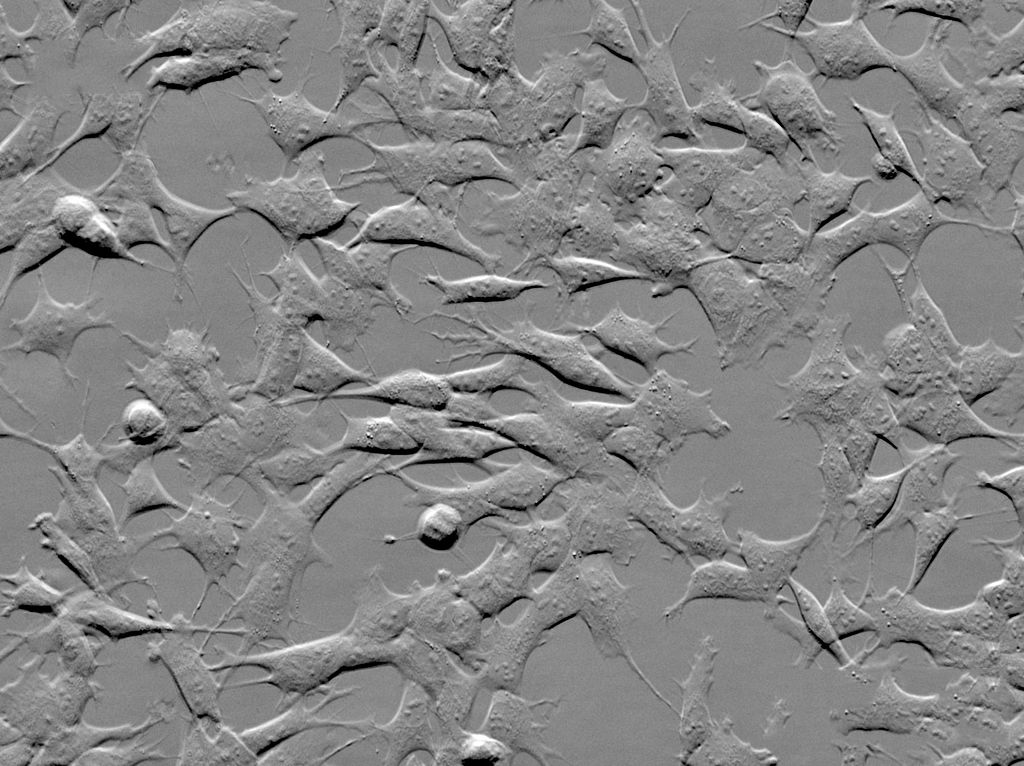
.jpg)
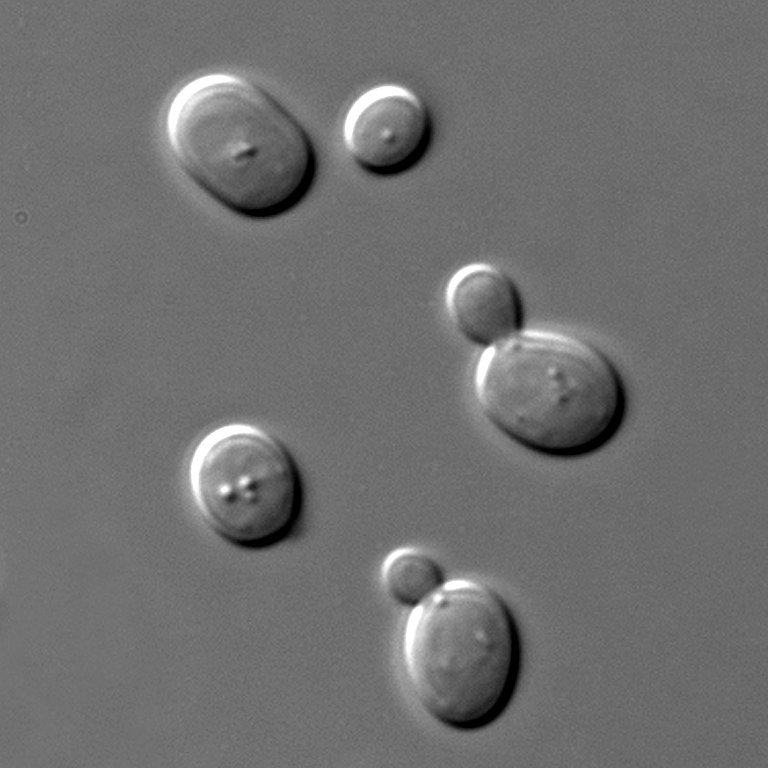
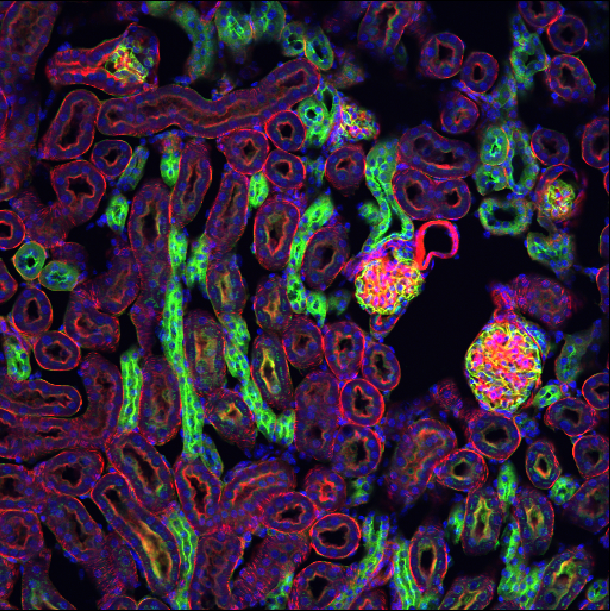
Widefield microscopes can also be used for fluorescence microscopy. In fluorescence microscopy, fluorescent labels are used that target specific features (like the nucleus or cell membrane). These labels are excited by a specific wavelength of light (the excitation wavelength), and then emit light of a longer wavelength (the emission wavelength). By illuminating the sample with light of the excitation wavelength, then detecting light of the emission wavelength, a fluorescence microscope can image the biological structures that the label is bound to.
It’s worth noting that optimising a fluorescence microscopy setup can be quite complex! For example, depending on the structure you want to image, it can be difficult to acquire labels that bind specifically and don’t interfere with normal function and localisation. This requires multiple initial tests to verify where a label binds, as well as the appropriate conditions to use (like incubation time / temperature). In addition, if you want to image multiple fluorescent labels at the same time, then you have to ensure there is minimal overlap between their excitation/emission wavelengths. Labels must also be chosen to match the available lasers/filters on your microscope of choice - otherwise you will be unable to properly excite and collect emitted light from them. These considerations are true for all types of fluorescence microscope - including widefield and also confocal (that will be discussed below).
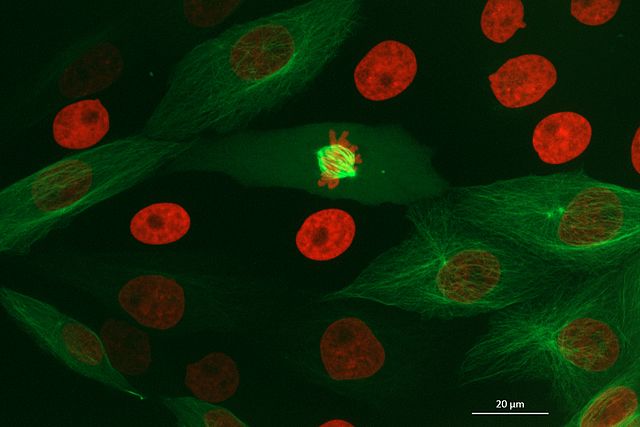
.jpg)
The main issue with widefield microscopes is that, due to the whole sample being illuminated, it can produce rather blurry images (especially for thicker samples). For example, in widefield fluorescence microscopy, fluorophores throughout the entire sample will be emitting light. This means that the resulting image will represent light from the focal plane, and also from out-of-focus planes above and below it. This can result in details being obscured by out-of-focus light.
Confocal
Confocal microscopes are capable of ‘optical sectioning’ meaning they can detect light only from the plane of focus and exclude light from out-of-focus planes. This is extremely useful, especially for thick samples, to achieve clear images where details aren’t obscured by out-of-focus light.
There are many different types of confocal microscopes, but one of the most common is laser scanning confocal microscopes. These are also known as point scanning confocal microscopes. In this microscope, a laser is focused onto a single point of the specimen at a time (rather than illuminating the entire sample). The point of illumination is then moved across the sample in a raster pattern (i.e. line by line), with light detected point by point. This gradually builds up the final image.
Confocal microscopes are typically used for fluorescence microscopy, especially when it is necessary to image the shape of structures in full 3D. However, this form of imaging also comes with some disadvantages. For example, confocal microscopes will generally be more complex to use and slower to acquire images than a widefield microscope. Although there are other types of confocal that are faster than laser scanning systems, such as ‘spinning disc confocal microscopes’. Spinning disc systems split the laser into hundreds of focused beams using an array of carefully arranged pinholes on a round disc. Spinning the disc causes the beams to rapidly scan across the sample and acquire an image, much faster than using a single beam as a standard laser-scanning confocal does. For more information, Jonkman et al.’s review gives a great summary of different confocal methods - e.g. see figure 2 for a comparison of laser-scanning and spinning disc confocals.
Super-resolution
Before the invention of ‘super-resolution’ methods, it was thought that light microscopes had a maximum resolution of around 200nm due to the ‘diffraction limit’ of light. Super-resolution methods allow microscopes to surpass this limit, achieving resolutions down to tens of nanometres. This allows many biological structures, previously only visible with techniques like electron microscopy, to be viewed with light microscopes. Many of these super-resolution systems are based on modified widefield or confocal microscope setups. The increase in resolution they provide usually comes at the cost of increased complexity in experiment/microscope setup. There are far too many types of super-resolution to cover in this episode, but Schermelleh et al. and Prakash et al provide useful reviews if you are interested.
Choosing a method
Choosing a light microscopy method is about finding the simplest and fastest approach that can address your research question. For example, does it provide the resolution you need? Can it provide good images of thick vs thin samples? Does it image a large enough area? Does it image fast enough to provide the temporal resolution you need?… The online bioimaging guide provides a useful flowchart to give you some ideas - as well as links to many other great microscopy resources. We’ve also placed a small summary table below of the microscopy techniques we covered in this episode.
If your research question can be solved by a simpler and less costly method, then usually this is the way to go! It’s all about choosing the right tool for the job - different approaches will be best for different research questions. For example, you could count cell number with a high-end super-resolution microscope, but this is also possible with a standard widefield which will be simpler and faster. In general, only move to more complex techniques when your research question really requires it. This also holds true for later steps like choosing image processing and statistical analysis methods.
| Technique | What is it? | Key points |
|---|---|---|
| Brightfield | Illuminates the sample with light from one side, and images on the other | Hard to see many biological structures - usually requires contrast agents/staining to increase contrast |
| Phase contrast / DIC | Makes use of slight changes in the ‘phase’ of light as it passes through a sample to increase contrast | Allows unstained samples to be seen more easily |
| Widefield fluorescence | Fluorescent labels (with specific excitation and emission wavelengths) bind to specific biological structures | Widefield illuminates the whole sample at once, which can lead to blurry images in thicker samples |
| Laser scanning confocal | A laser is scanned across the sample point by point in a raster pattern | Allows ‘optical sectioning’, giving clearer images in full 3D. More complex to use than widefield, also slower to acquire images. |
| Spinning disc confocal | An array of pinholes on a disc split the laser into hundreds of beams that move across the sample | Faster than standard laser scanning confocal |
| Super-resolution | Wide range of methods that break the classic ‘diffraction limit’ of light, allowing resolutions down to tens of nanometres | More complex to use than standard widefield / confocal |
Which microscope?
Which light microscopes could be used to answer our research question - ‘Does the chemical affect the number, size or shape of cell nuclei over time?’
Think about the points above and make a list of potential answers. It may be best to discuss in a group, so you can share different ideas.
Again, there’s no one solution here - it depends on which elements of nucleus shape and size we’re focusing on. If we’re happy with 2D measures, then widefield fluorescence microscopy would be a great option to allow large numbers of nuclei to be imaged over time.
If we’re more interested in the precise 3D volume and shape, then confocal fluorescence microscopy would be a better fit. We’d have to be careful with how often we wanted to image the cells vs the speed of acquisition though.
As we are using live cell imaging, we have to carefully consider how often we need to take an image to answer our research question. For example, if we want to track the rapid movement and divisions of individual nuclei, then we will need to image quickly, with a small time interval between each image. Alternatively, if we only need to measure overall changes in mean nucleus number/size/shape (without exactly tracking every nucleus) then we can allow much longer time intervals between each image. For rapid imaging, it may be necessary to use a microscope specialised for high speed (such as a spinning disc confocal), otherwise slower methods (such as a standard laser scanning confocal) can also work very well.
Super-resolution options wouldn’t be required here. Cell nuclei can be easily visualised with standard widefield and confocal approaches, as they have a large diameter of around 5-20 micrometre (depending on cell type). This is well above the classic ‘diffraction limit’ of around 200nm that we discussed in the super-resolution section. There’s no need to introduce any extra complexity, as our research question doesn’t require that level of resolution.
-
A general workflow for designing a light microscopy experiment should include:
- Define your research question
- Define what you need to observe to answer that question
- Define what you need to measure to answer that question
- Choose a light microscopy method that fits your data needs
- Choose acquisition settings that fit your data needs
There are many different types of light microscope - including widefield and confocal
You should choose the simplest methods (in acquisition, processing, and statistical analysis) that allow you to address your research question