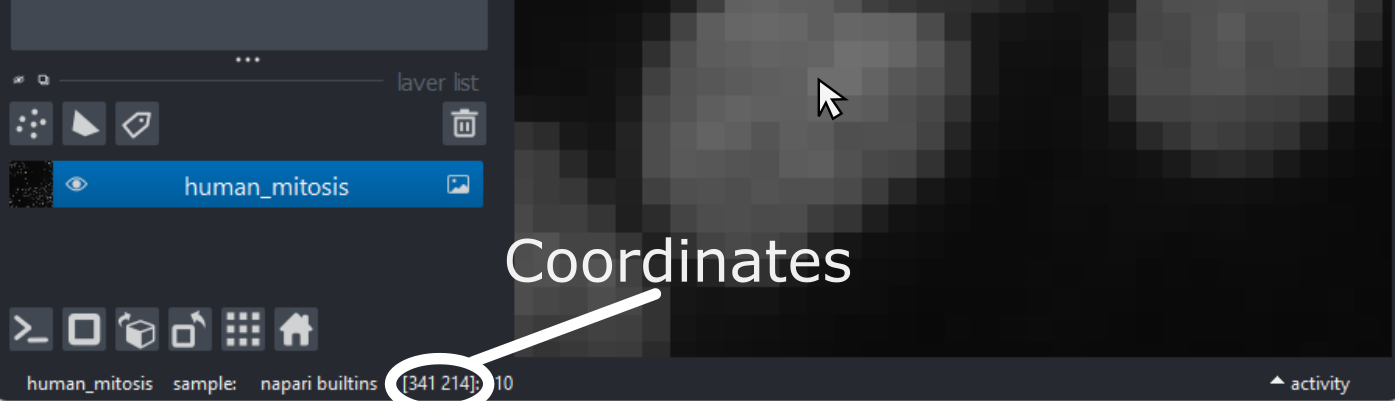
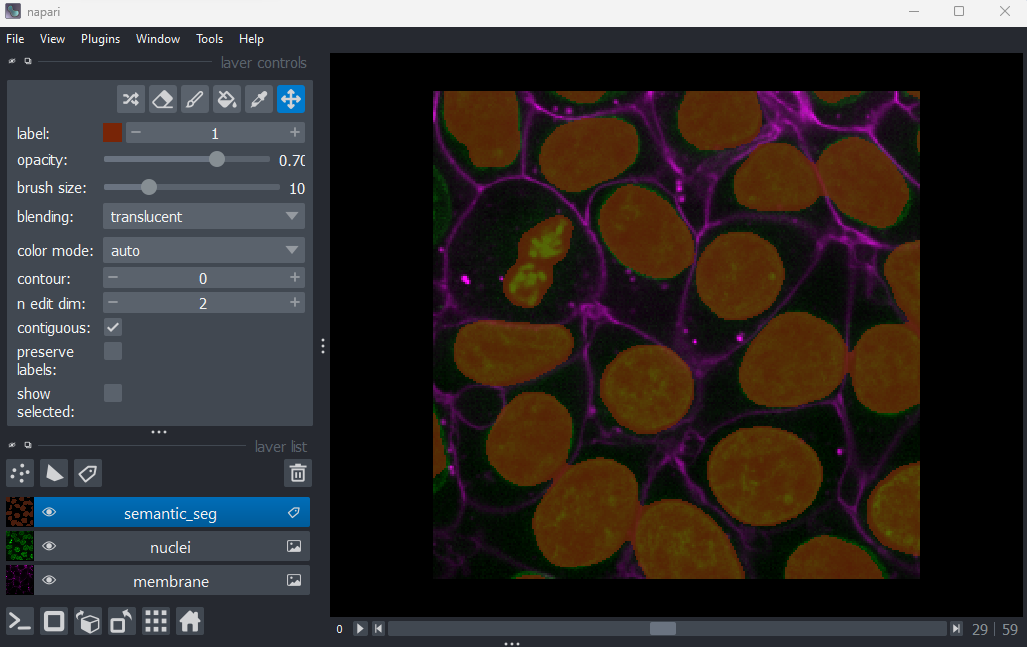
Image 1 of 1: ‘A screenshot of a rough semantic segmentation of nuclei in Napari’
Figure 2
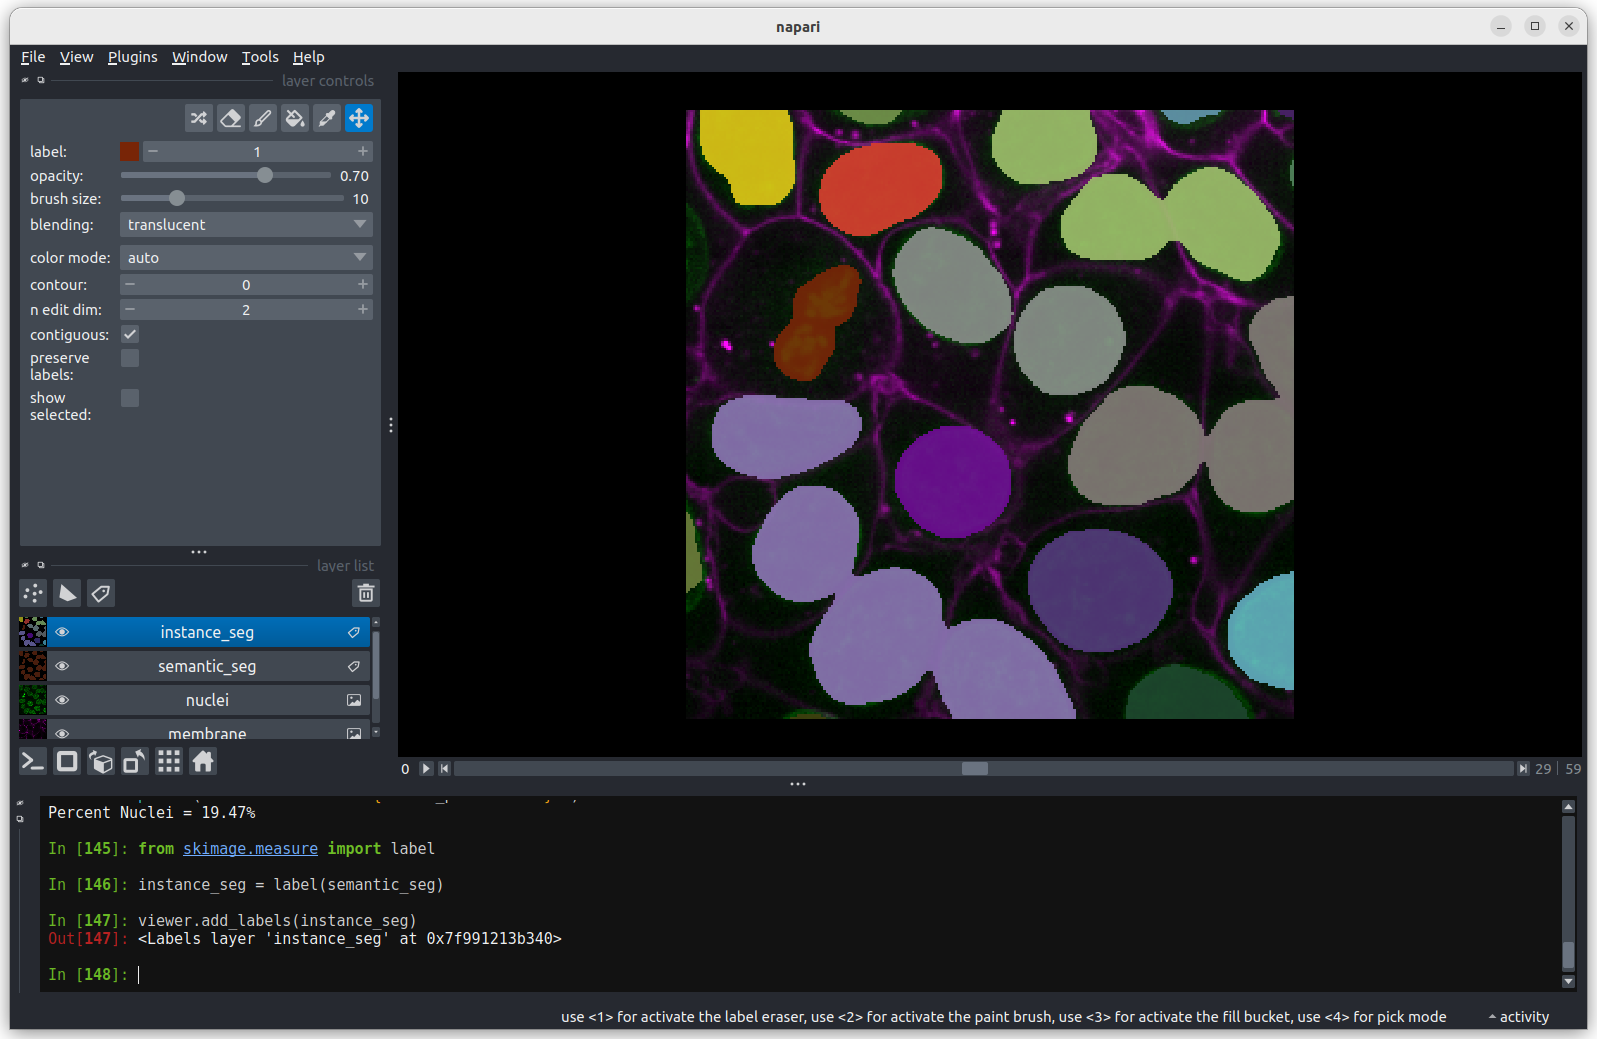
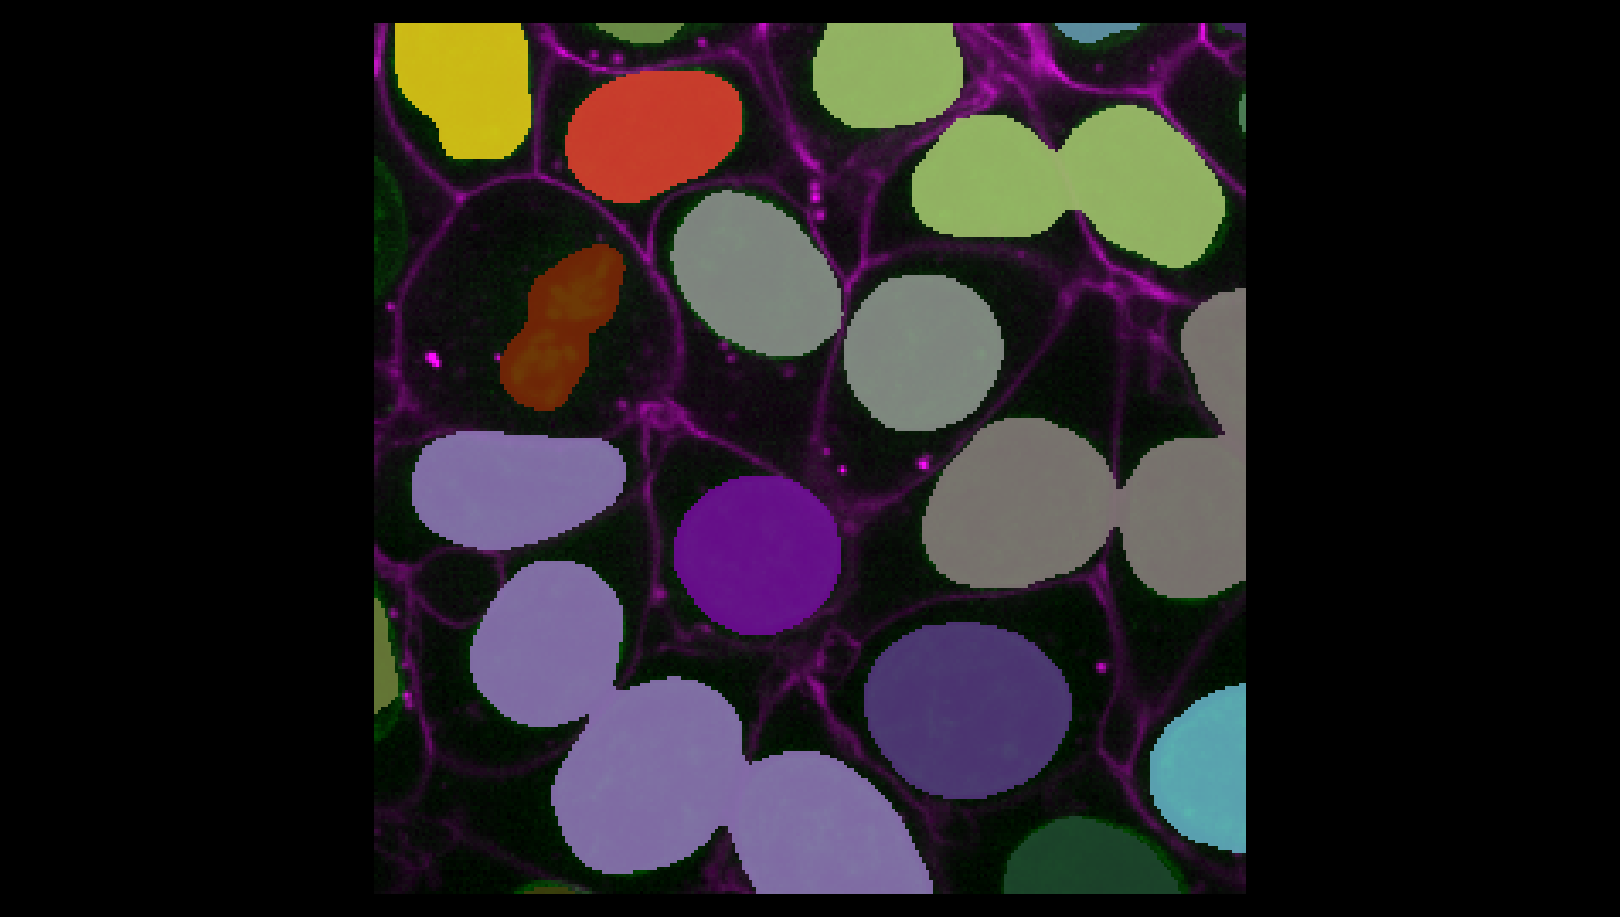
Image 1 of 1: ‘A screenshot of an instance segmentation of nuclei with some incorrectly joined instances.’
Figure 3
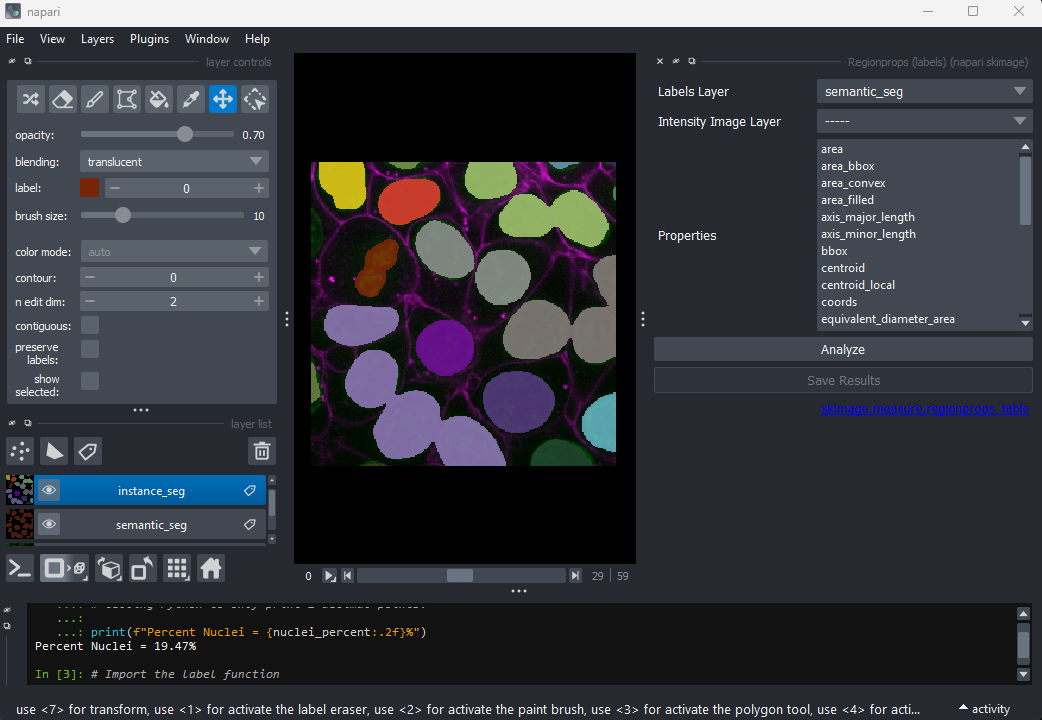
Image 1 of 1: ‘A screenshot of the napari-skimage Regionprops widget at startup.’
In the napari toolbar, open
Layers > Measure > Regionprops (labels) (skimage).
You should see a dialog like this:
Figure 4
Image 1 of 2: ‘Napari's hide visibility icon’
Image 2 of 2: ‘A screenshot of the numeric value table created by the napari-skimage plugin’
Click Analyze - a table of numeric values should appear
in napari. If it opens in an inconvenient location, you can click and
drag on the header containing the x, and other icons
next to the table window to reposition it.
Figure 5
Image 1 of 1: ‘A screenshot of an instance segmentation of nuclei.’
Figure 6
Image 1 of 1: ‘Napari's 2D/3D toggle’
You may remember from our first
lesson that we can change to 3D view mode by pressing the button. Try it now.
Figure 7
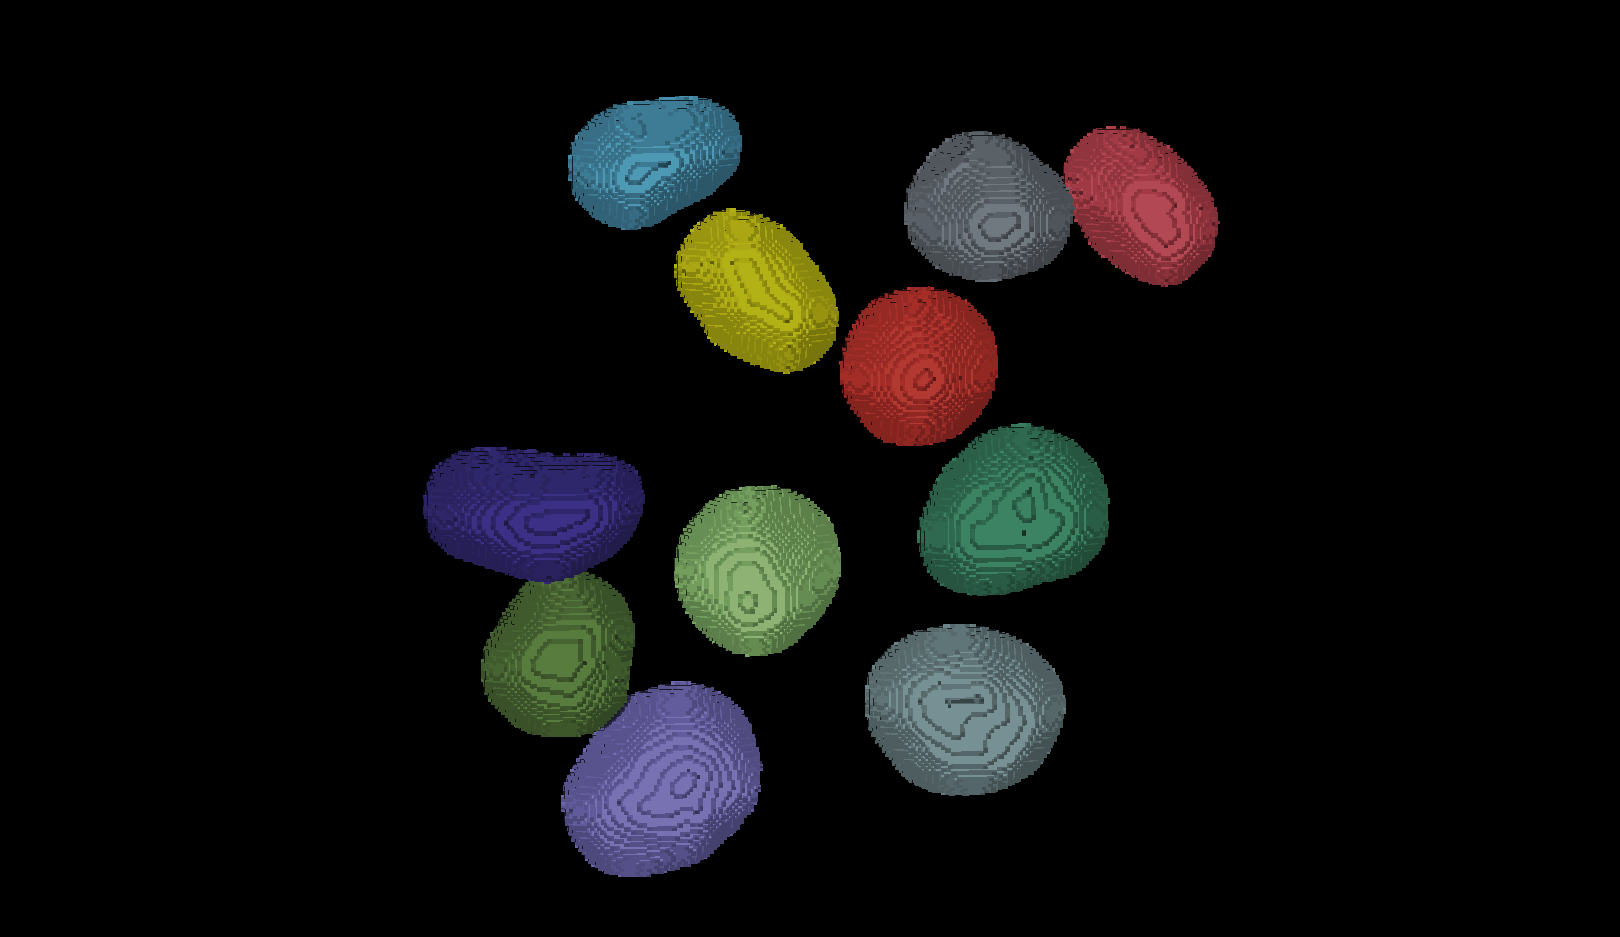
Image 1 of 1: ‘A screenshot of an instance segmentation of nuclei in 3D mode with some incorrectly joined instances.’
You should see the image rendered in 3D, with a clear join between the
upper most light purple nucleus and its neighbour.
Figure 8
Image 1 of 1: ‘A screenshot region-props dialog highlighting the smallest nucleus.’
Figure 9
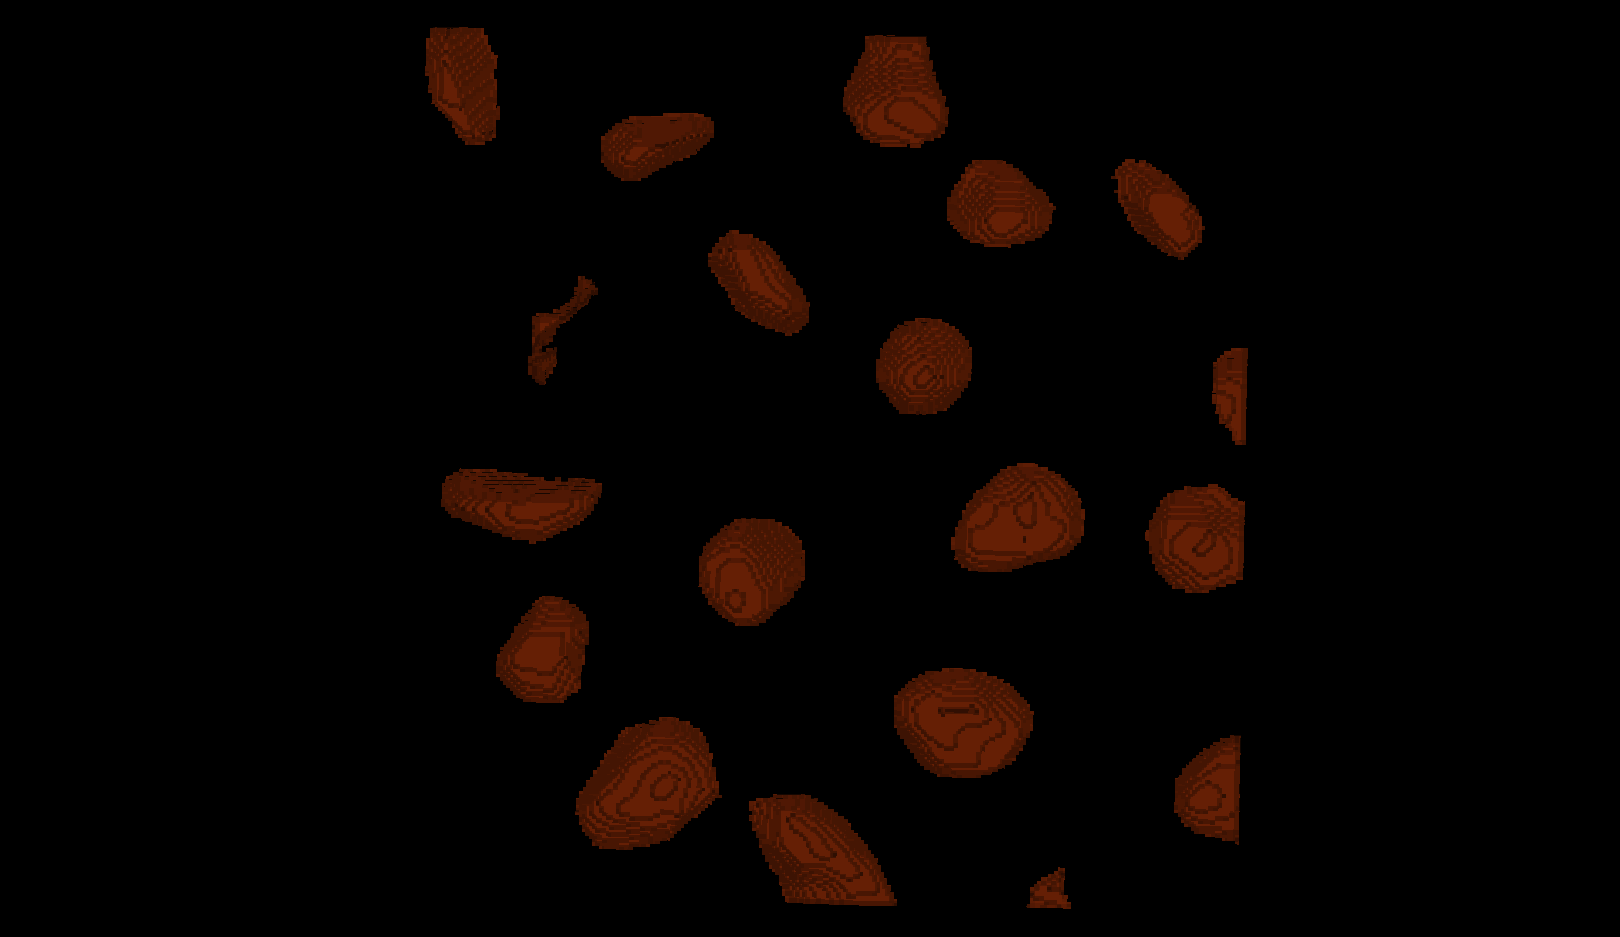
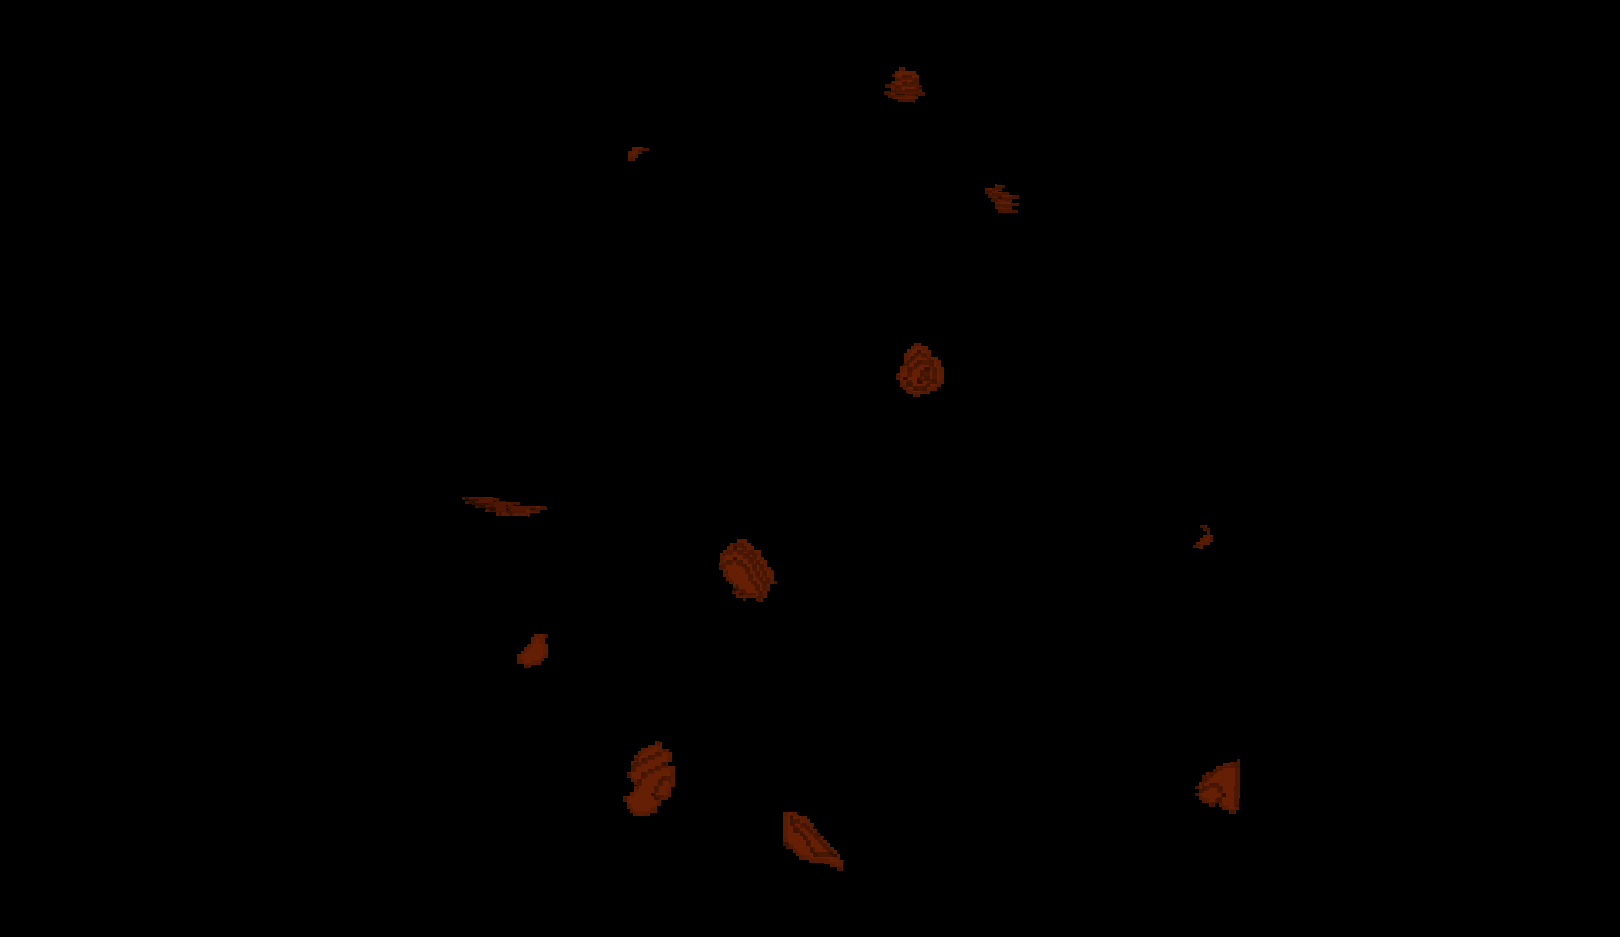
Image 1 of 1: ‘Semantic segmentation mask eroded with a ball of radius 5.’
Some nuclei that are touching remain partially
connected.
Figure 10
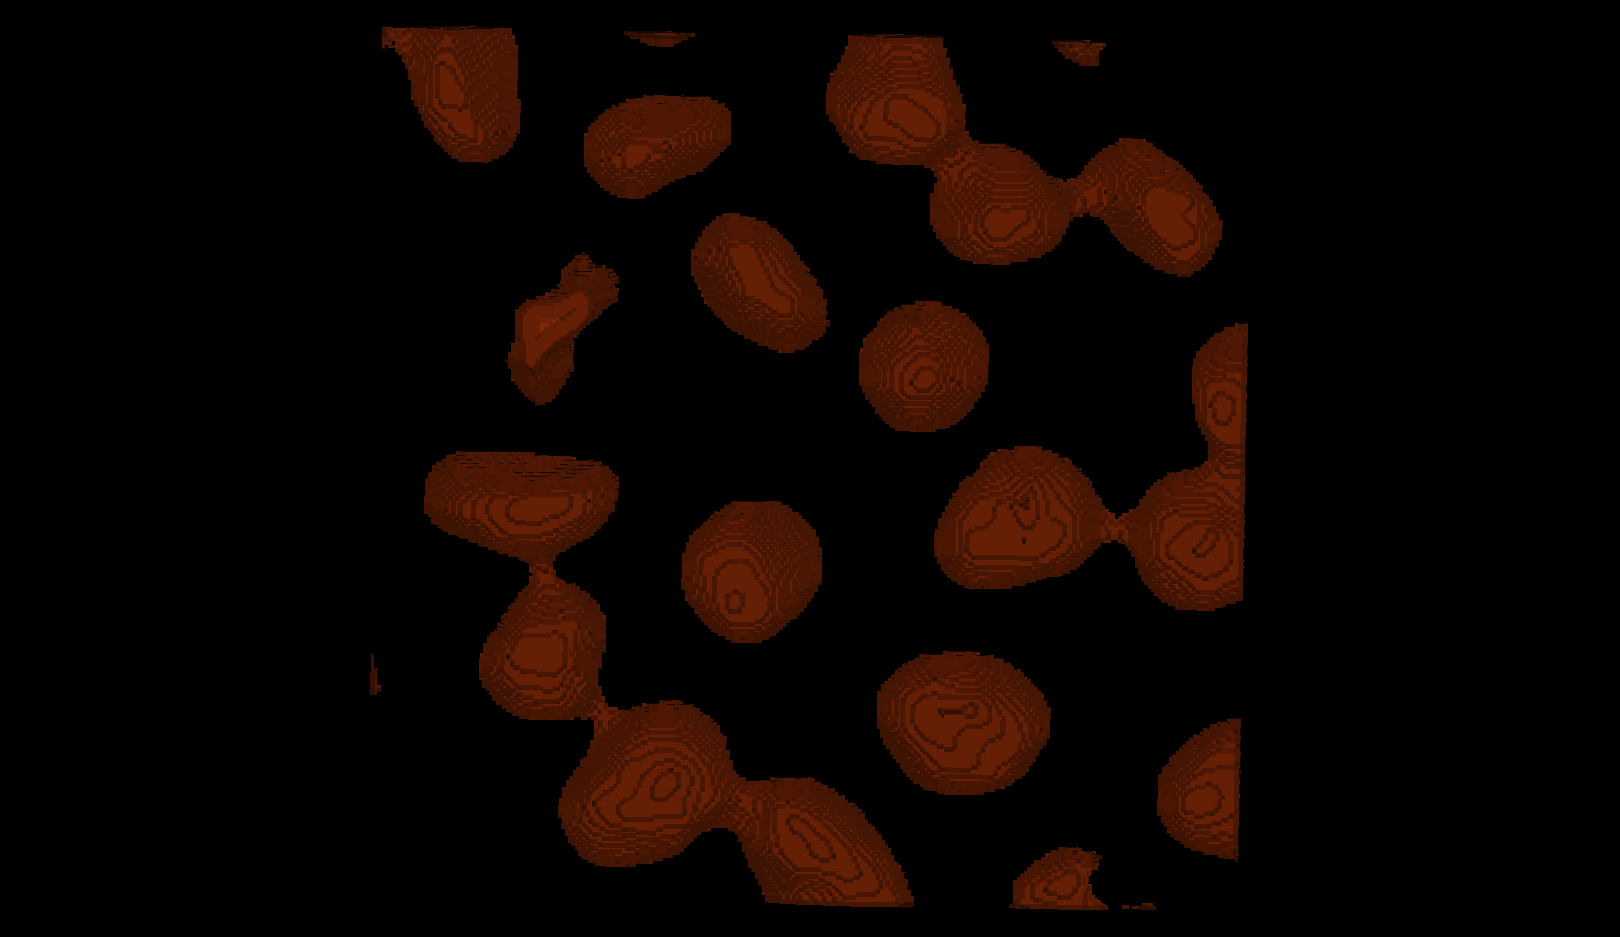
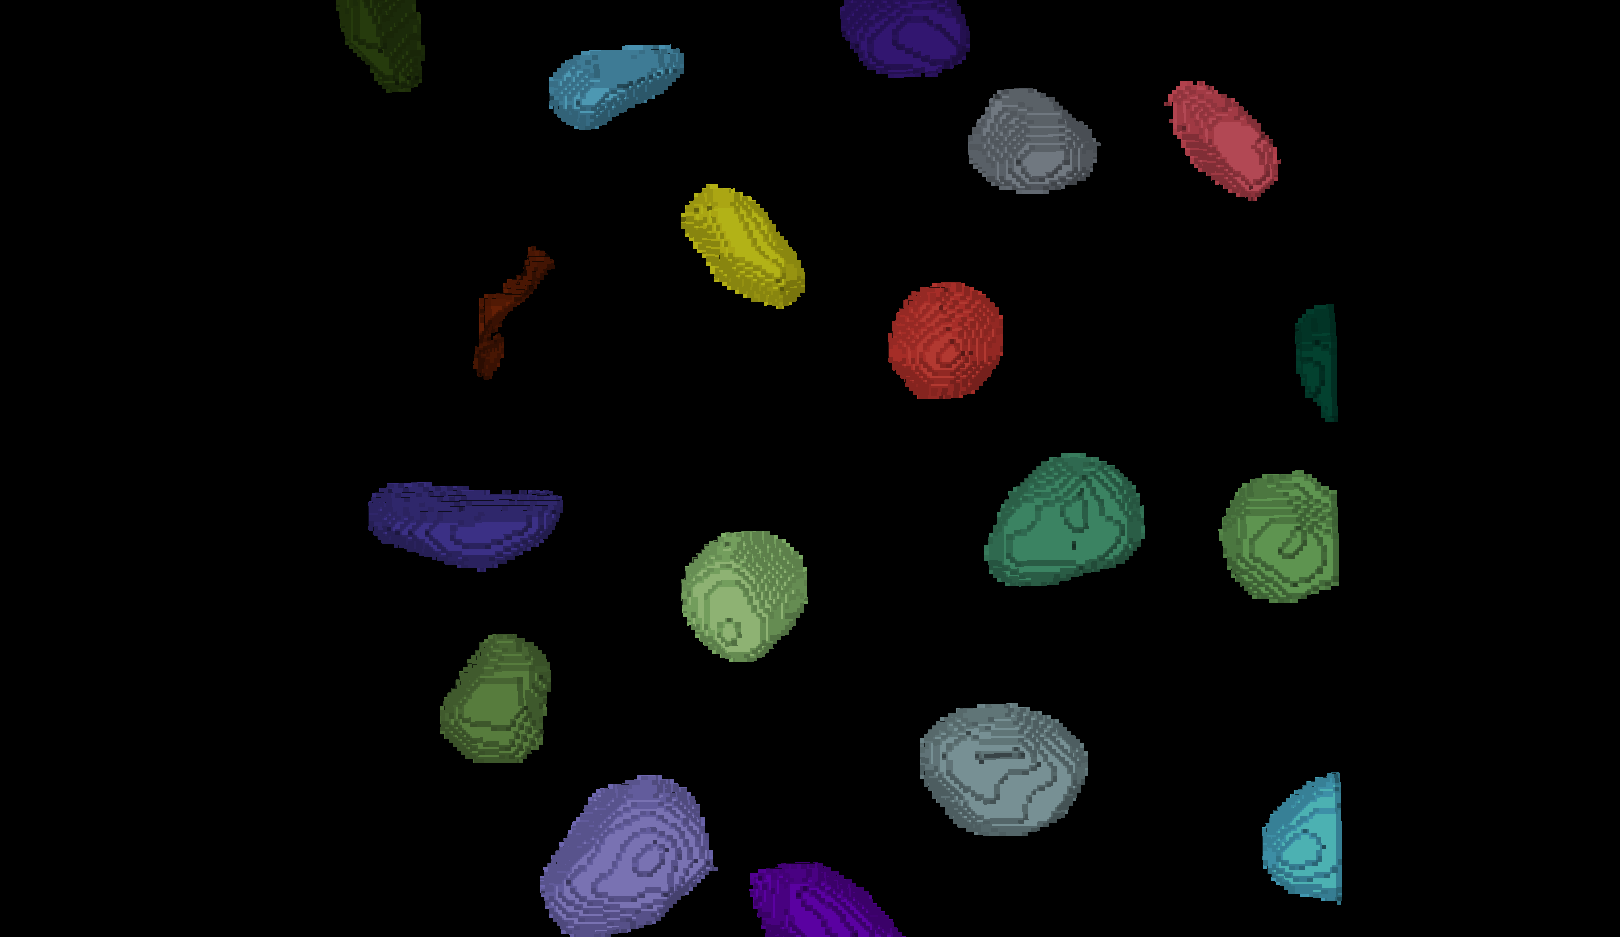
Image 1 of 1: ‘Semantic segmentation mask eroded with a ball of radius 10.’
Erosion with a radius of 10 removes enough pixels to separate
touching nuclei
while still keeping the nuclei you want to analyse.
Figure 11
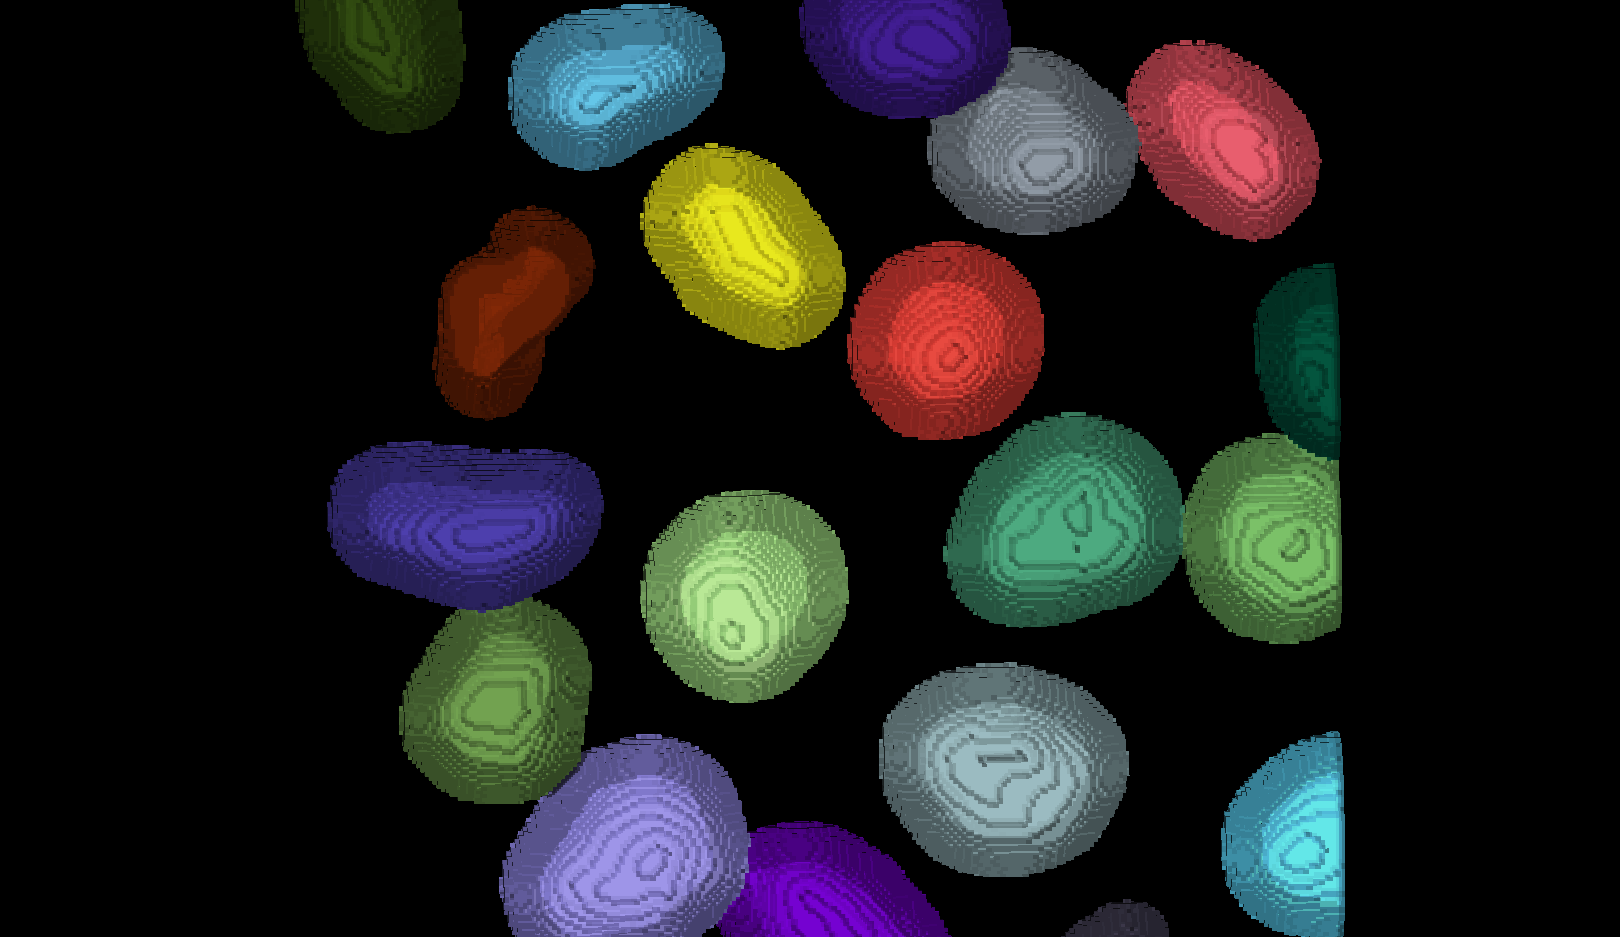
Image 1 of 1: ‘Semantic segmentation mask eroded with a ball of radius 15.’
Erosion with a radius of 15 is too strong: several nuclei become
over‑eroded
and some disappear completely.
Figure 12
Image 1 of 1: ‘Instance segmentation on the eroded segmentation mask’
Figure 13
Image 1 of 1: ‘Dilated instance segmentation on the eroded segmentation mask’
There are now 19 apparently correctly labelled nuclei that appear to be
the same shape as in the original mask image.
Figure 14
Image 1 of 1: ‘A comparison between the expanded instance segmentation and the original semantic segmentation showing some mismatch between the borders.’
Looking at the above image we can see some small mismatches around the
edges of most of the nuclei. It should be remembered when looking at
this image that it is a single slice though a 3D image, so in some cases
where the differences look large (for example the nucleus at the bottom
right) they may still be only one pixel deep. Will the effect of this on
the accuracy of our results be significant?
Figure 15
Image 1 of 1: ‘The instance segmentation with any nuclei crossing the image boundary removed’

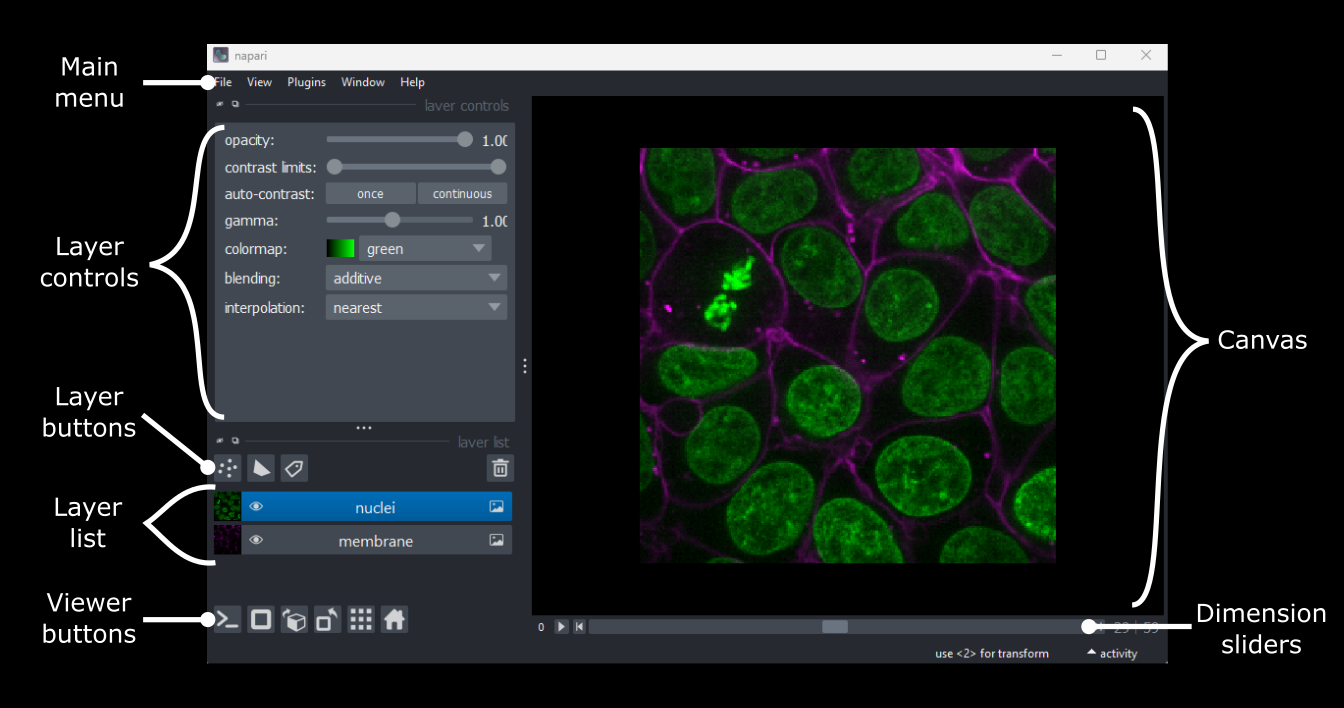
 sand More
sliders can appear if our image has more dimensions (e.g. time series,
or further channels).
sand More
sliders can appear if our image has more dimensions (e.g. time series,
or further channels).
 /
/ 









 icon on the left side.
 and other icons
next to the table window to reposition it.
and other icons
next to the table window to reposition it. 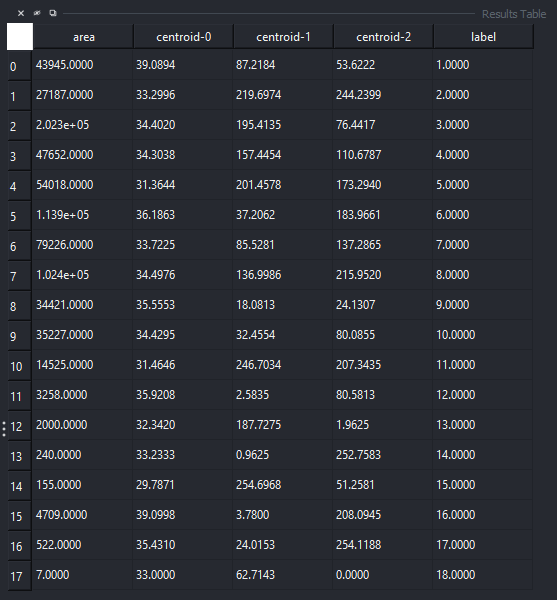
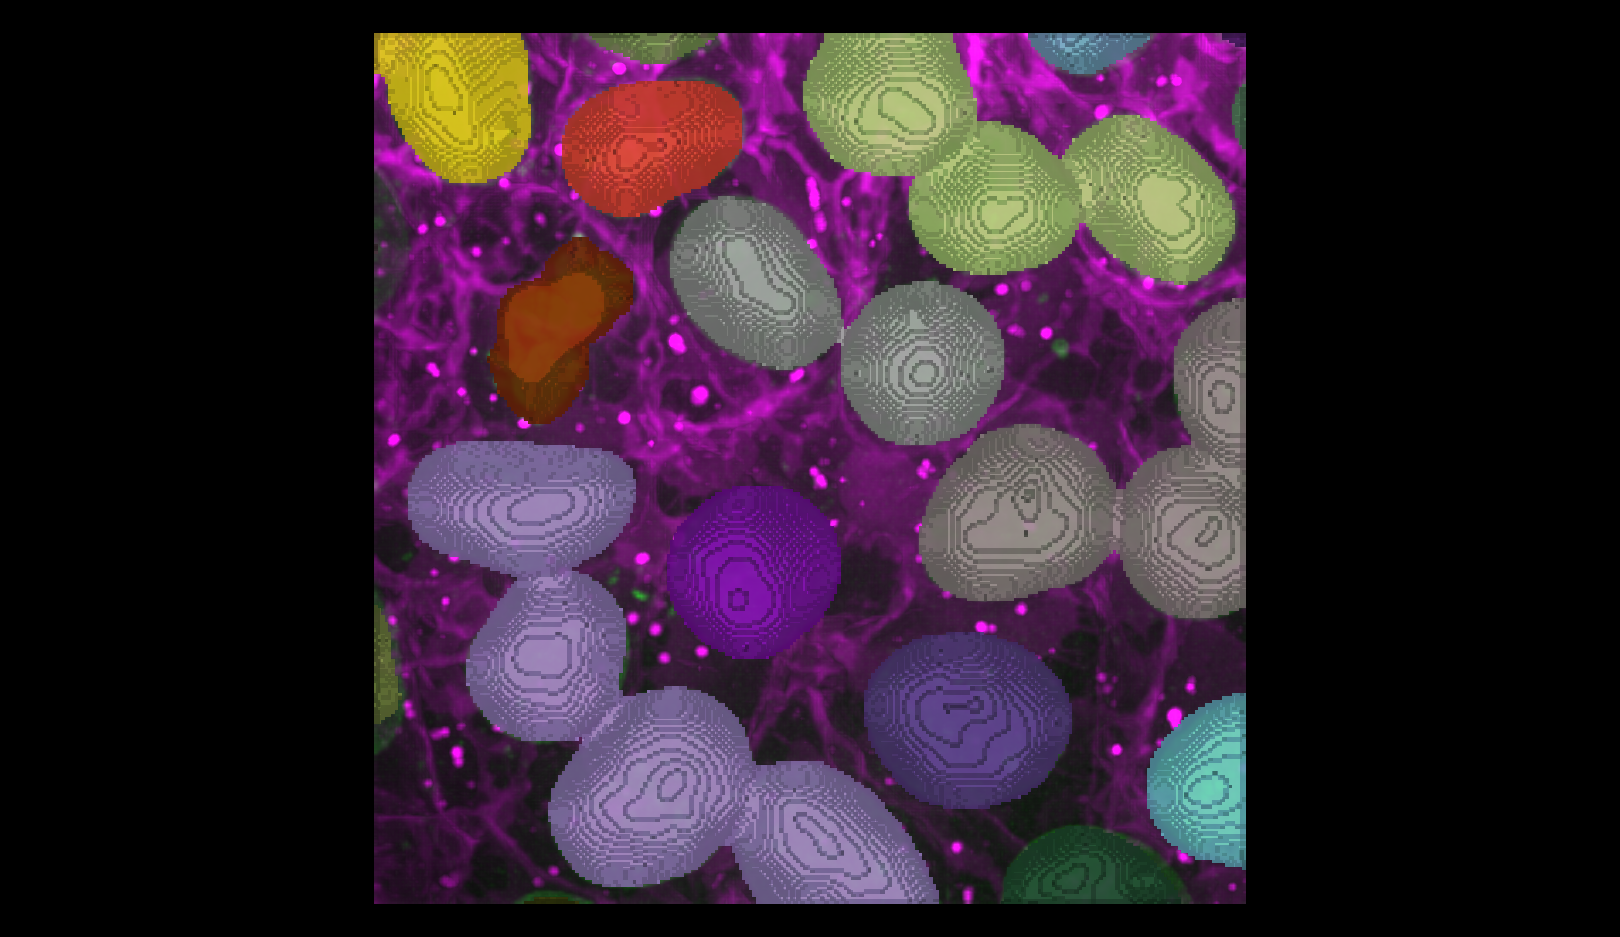 You should see the image rendered in 3D, with a clear join between the
upper most light purple nucleus and its neighbour.
You should see the image rendered in 3D, with a clear join between the
upper most light purple nucleus and its neighbour.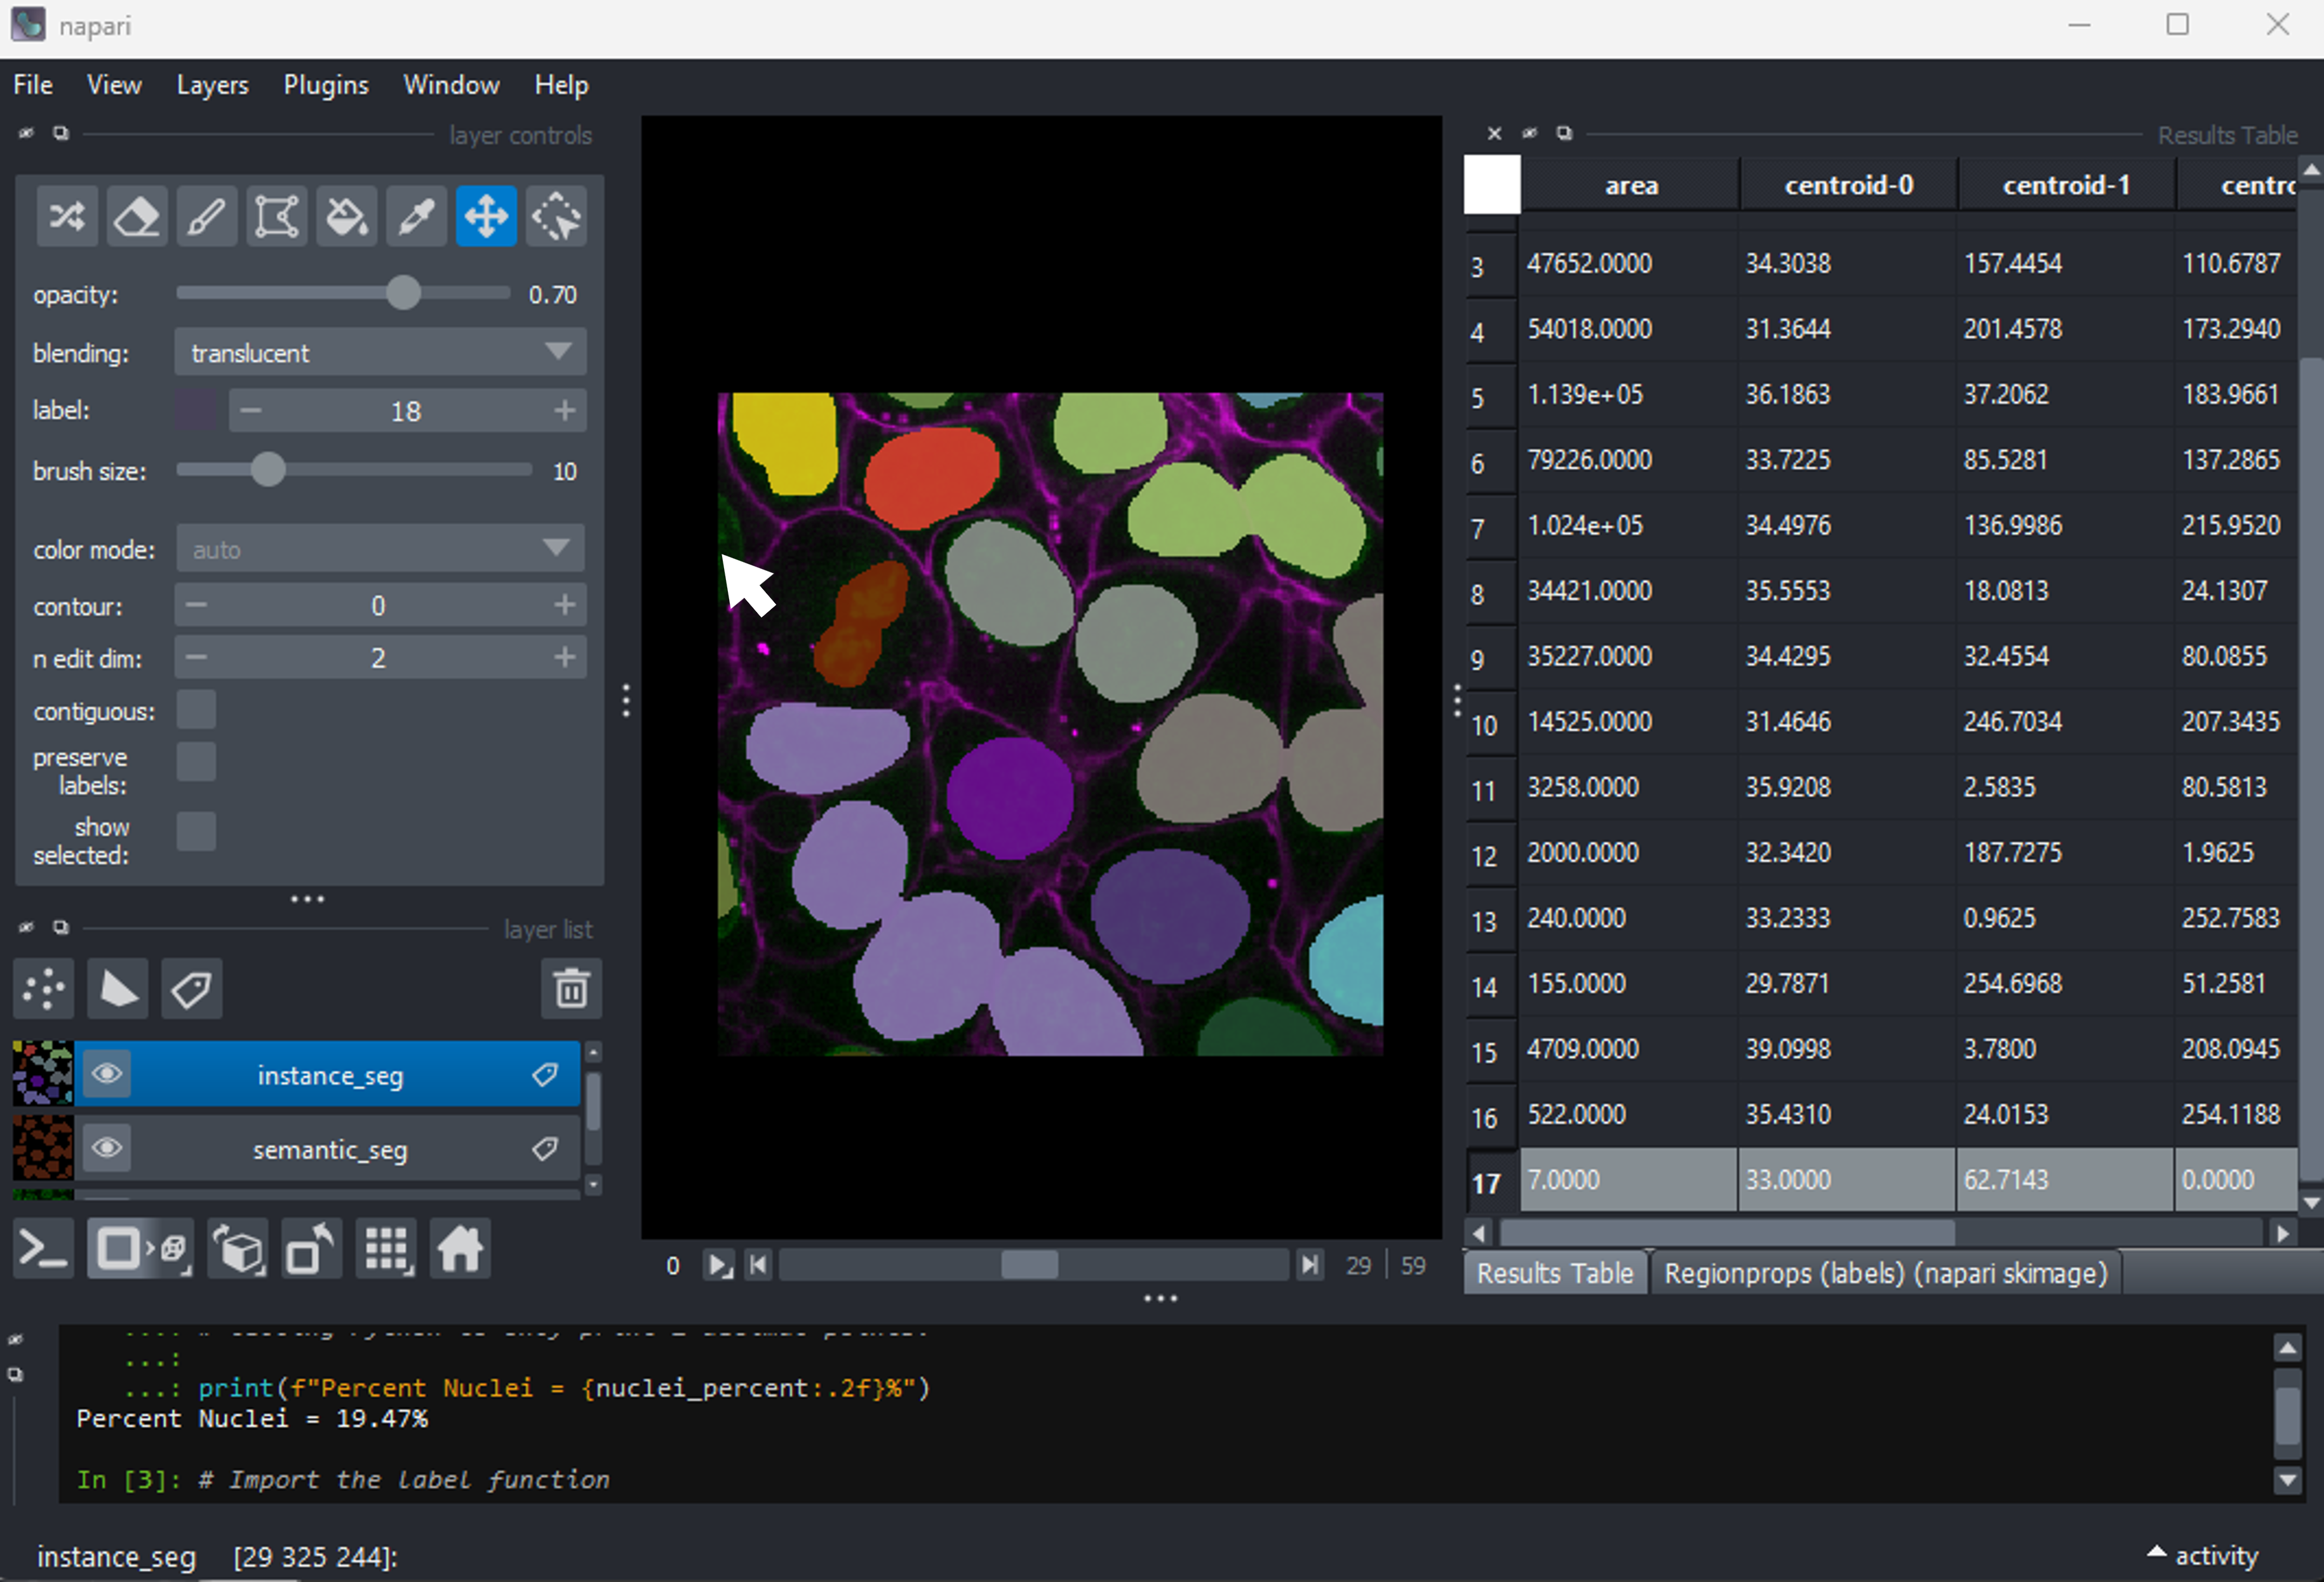
 There are now 19 apparently correctly labelled nuclei that appear to be
the same shape as in the original mask image.
There are now 19 apparently correctly labelled nuclei that appear to be
the same shape as in the original mask image.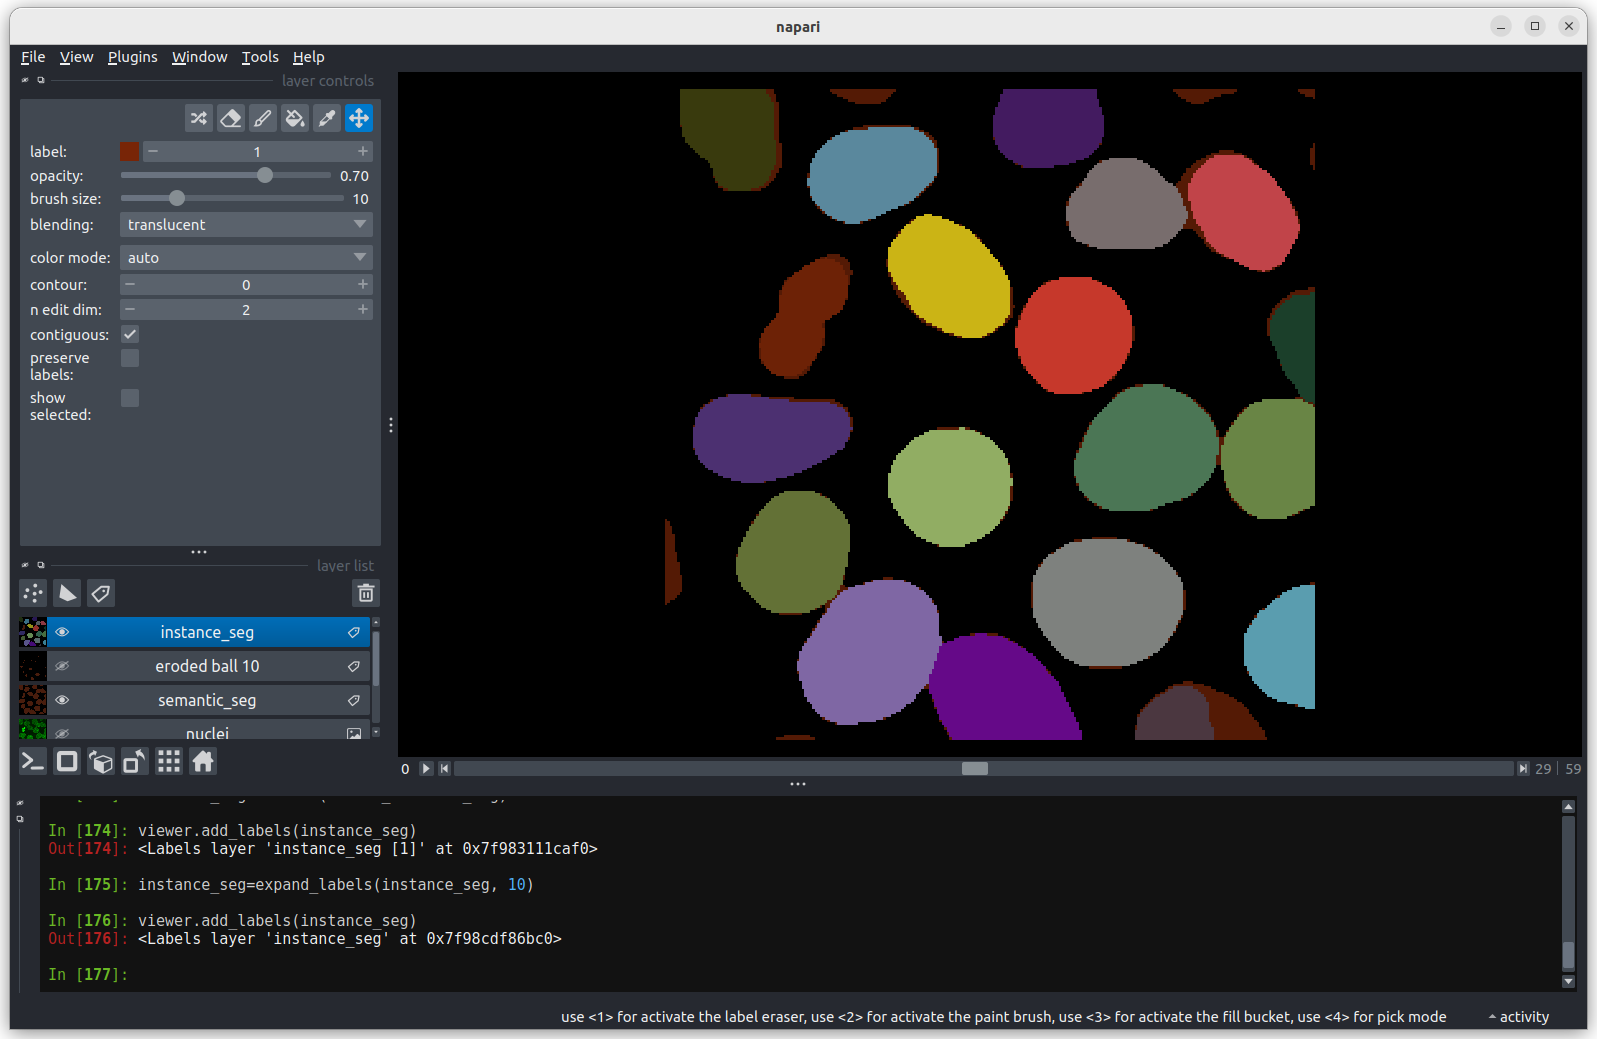 Looking at the above image we can see some small mismatches around the
edges of most of the nuclei. It should be remembered when looking at
this image that it is a single slice though a 3D image, so in some cases
where the differences look large (for example the nucleus at the bottom
right) they may still be only one pixel deep. Will the effect of this on
the accuracy of our results be significant?
Looking at the above image we can see some small mismatches around the
edges of most of the nuclei. It should be remembered when looking at
this image that it is a single slice though a 3D image, so in some cases
where the differences look large (for example the nucleus at the bottom
right) they may still be only one pixel deep. Will the effect of this on
the accuracy of our results be significant?