Why harmonisation is needed
This part of the lecture shows why images are different. Even the scans of the same individual show differences in physiological noise, instrument noise, differences in hardware and software. The gold standard of identifying these differences is often a “travelling head” study, where a small handful of individuals are scanned at multiple sites. The first part of the demo demonstrated at the notebook index.ipynb, is to look at two scans from the same individual on a different scanner. We register the data of the two sites longitudinally and then show shape/intensity/geometric differences—potential data sources: GENFI examples.
Launching the notebook
By clicking on the first notebook, you can start to see an example of differences in the images acquried of the same subject by two different scanners.
Background
Magnetic resonant imaging (MRI) is used in many different diseases of neuroimaging. It can provide multiple brain measures, from volumetric measures of key brain structures and of disease-related lesions, microstructural integrity, and various functional measures around brain networks and perfusion. However, most clinical MRI scanners are designed with a higher priority towards producing high quality images for visual interpretatio. Scanner manufacturers are also highly focused on innovation to provide better funcationality to theirr customers, rather than standardisation with other hospitals who might not be using their equipment. As a result, these priroties often take precedence over producing truly quantitative outputs where the measure from one scanner could be reproduced on another scanner model or another scanner manufacturer. This can make it difficult to compare data across imaging sites and scanners over time.
As research in this area shifts to earlier detection of small but relevant changes, exploring disease heterogeneity in a more representative sample of the population, and using machine learning applications to find complex multivariate patterns which might provide new insights on various diseases, there is a clear need for the size and scope of datasets to increase. In many studies, the only way to practically achieve this is by increasing the number of acquisition sites in the study. This comes with the potential risk of added variability arising from these different sites, mainly from differences in imaging hardware and acquisition parameters.
The success of combining multi-site data depends on the comparability of the images across the sites. We need to compare a relatively big sample size, which increases variability. This variability could be technical across scans, for example, variations in the scanning parameters such as:
- Different scanning manufactures and differences in hardware (head coils, gradients, etc.)
- Different implementations of sequences between vendors
- Different parameters between sites. The variability also could be due to heterogeneity in the imaging protocol and various local procedures, such as QA processes, that could affect the acqusiition. All of these then get mixed in with the different populations samplings at each site, such that statsitical anlyses must be able to tease out what effects are biological in nature versus those arising from the technical factors.
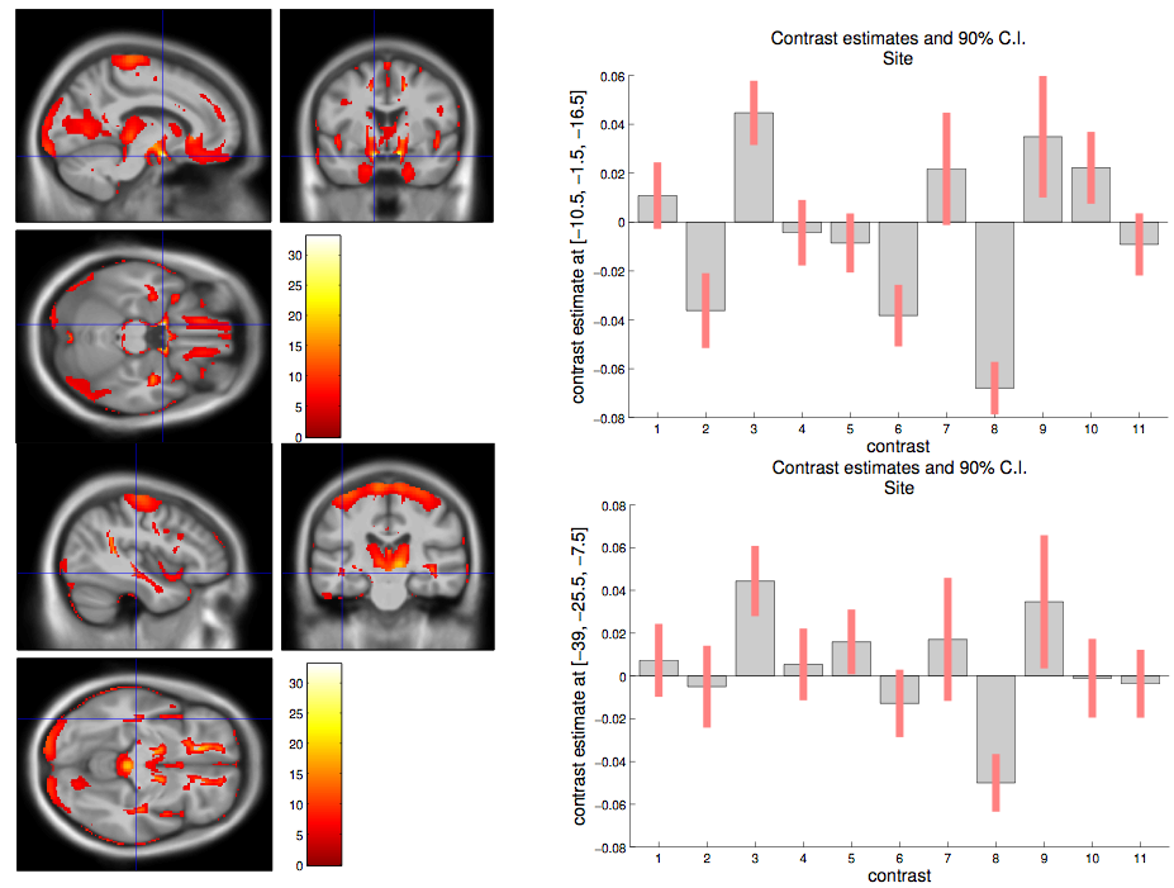
Here is an example of site-related differences that were found in a whole brain analysis of individuals from genetic frontodemporal dementia. This figure is part of work done in the paper Patterns of gray matter atrophy in genetic frontotemporal dementia: results from the GENFI study by Cash DM et al. It shows that at a voxel level there are many statistically signficiant differences in means between the sites.