
Getting Started With Napari
Last updated on 2026-09-22 | Edit this page
Estimated time: 10 minutes
Overview
Questions
- How can Napari be used to view images?
- How can I interact Napari through the console or via Jupyter Lab?
Objectives
- Use Napari to open images
- Navigate the Napari viewer (pan/zoom/swapping between 2D and 3D views…)
- Change colormap (LUT) in Napari
- Explain the main parts of the Napari user interface
- Install plugins from Napari Hub
In this section, we will open up with Napari in a number of different ways, and understand how it represents images, as well as measurements derived for it.
Opening Napari
Let’s get started by opening a new Napari window - you should have already followed the installation instructions. Note this can take a while the first time, so give it a few minutes!
BASH
# Change micro-sam to wherever you put your environment
cd napari-ai-workshop
source .venv/bin/activate
napari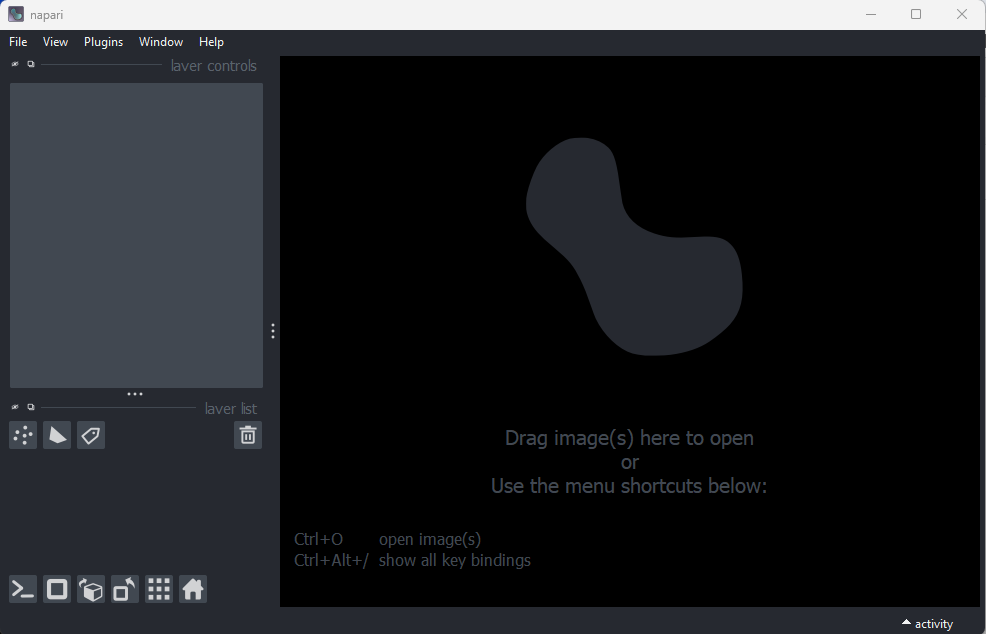
Opening images
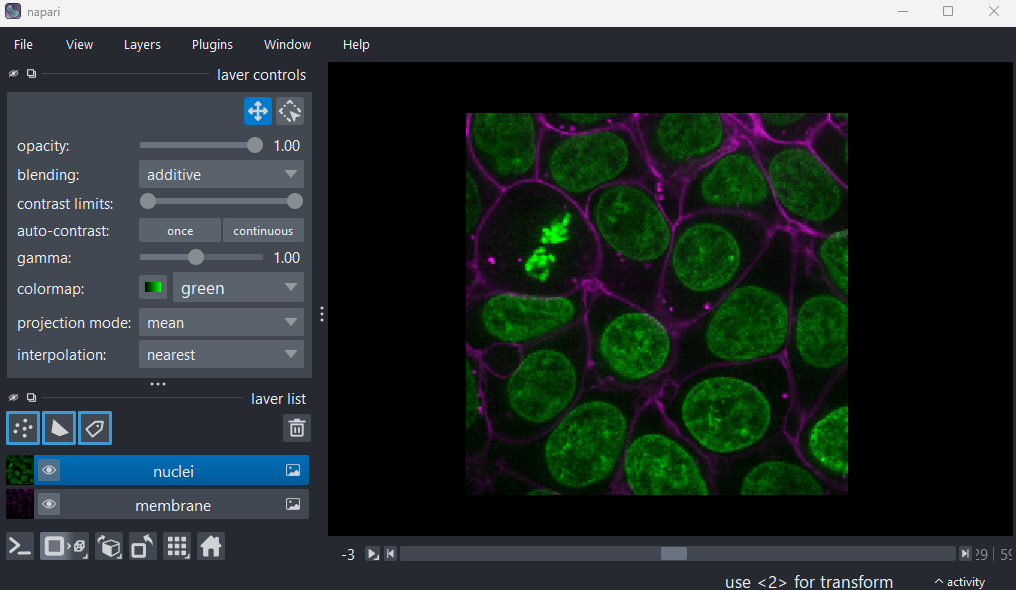
Napari comes with some example images - let’s open one now. Go to the
top menu-bar of Napari and select:File > Open Sample > napari builtins > Cells (3D+2Ch)
You should see a fluorescence microscopy image of some cells:
Napari’s User interface
Napari’s user interface is split into a few main sections, as you can see in the diagram below (note that on Macs the main menu will appear in the upper ribbon, rather than inside the Napari window):
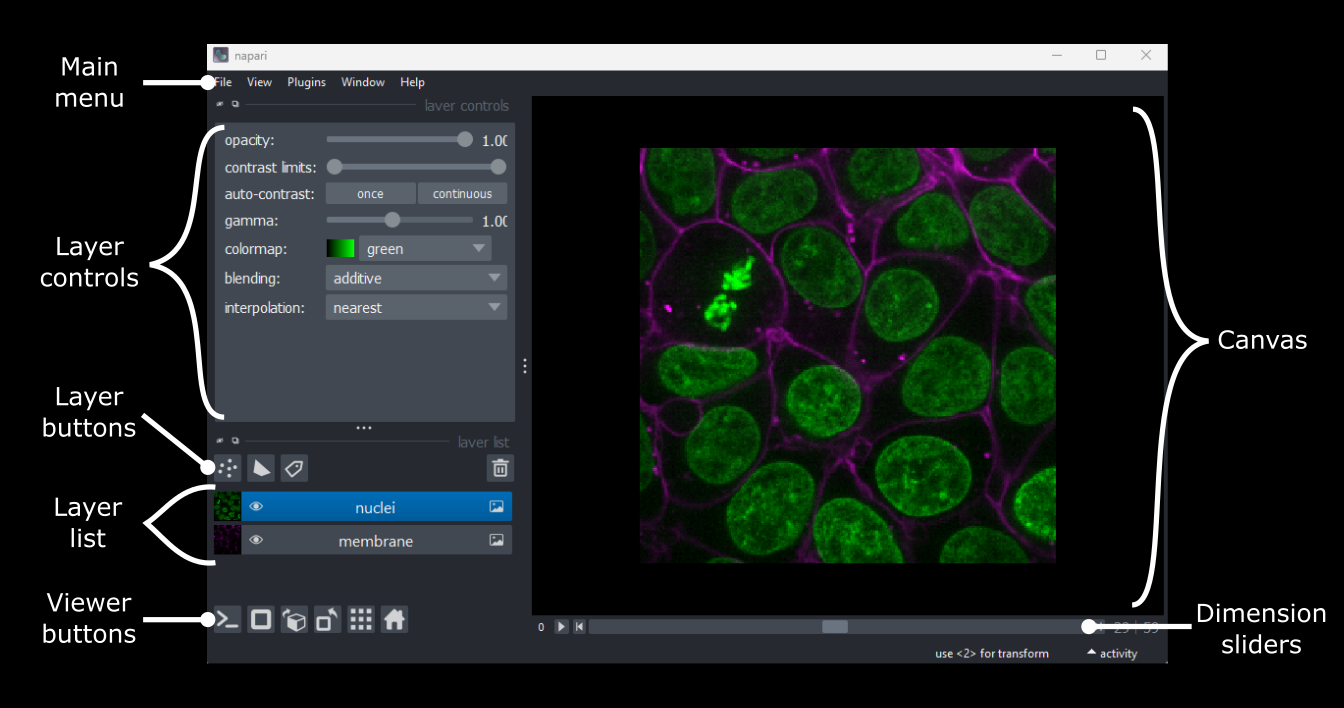
Let’s take a brief look at each of these sections - for full information see the Napari documentation.
Main menu
We already used the main menu in the last section to open a sample image. The main menu contains various commands for opening images, changing preferences and installing plugins (we’ll see more of these options in later episodes).
Canvas
The canvas is the main part of the Napari user interface. This is where we display and interact with our images.
Try moving around the cells image with the following commands:
Pan - Click and drag
Zoom - Scroll in/out (use the same gestures with your mouse
                      that you would use to scroll up/down
                      in a document)
Dimension sliders
Dimension sliders appear at the bottom of the canvas depending on the type of image displayed. For example, here we have a 3D image of some cells, which consists of a stack of 2D images. If we drag the slider at the bottom of the image, we move up and down in this stack:
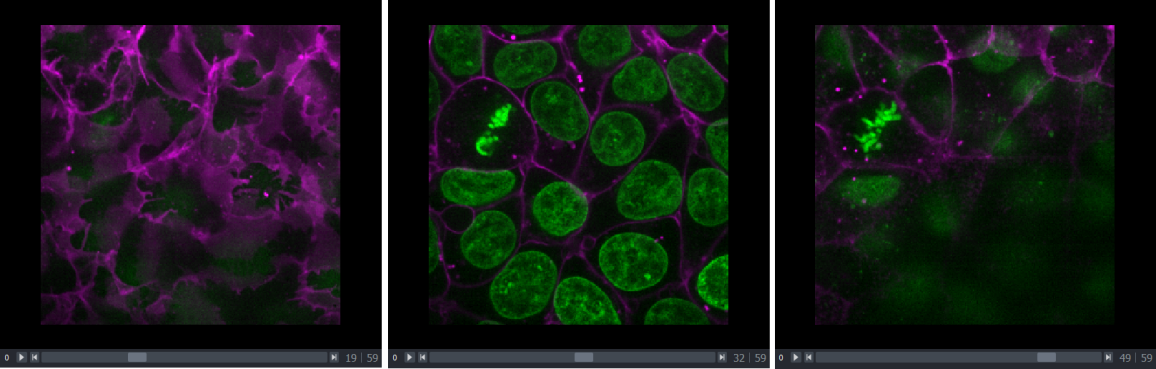
Pressing the arrow buttons at either end of the slider steps through one slice at a time. Also, pressing the ‘play’ button at the very left of the slider moves automatically through the stack until pressed again.
 sand More
sliders can appear if our image has more dimensions (e.g. time series,
or further channels).
sand More
sliders can appear if our image has more dimensions (e.g. time series,
or further channels).
Viewer buttons
The viewer buttons (the row of buttons at the bottom left of Napari) control various aspects of the Napari viewer:
Console 
This button opens Napari’s built-in python console, where we can enter in Python commands to interact with the imaging data.
2D/3D  /
/ 
This switches the canvas between 2D and 3D display. Try switching to the 3D view for the cells image:
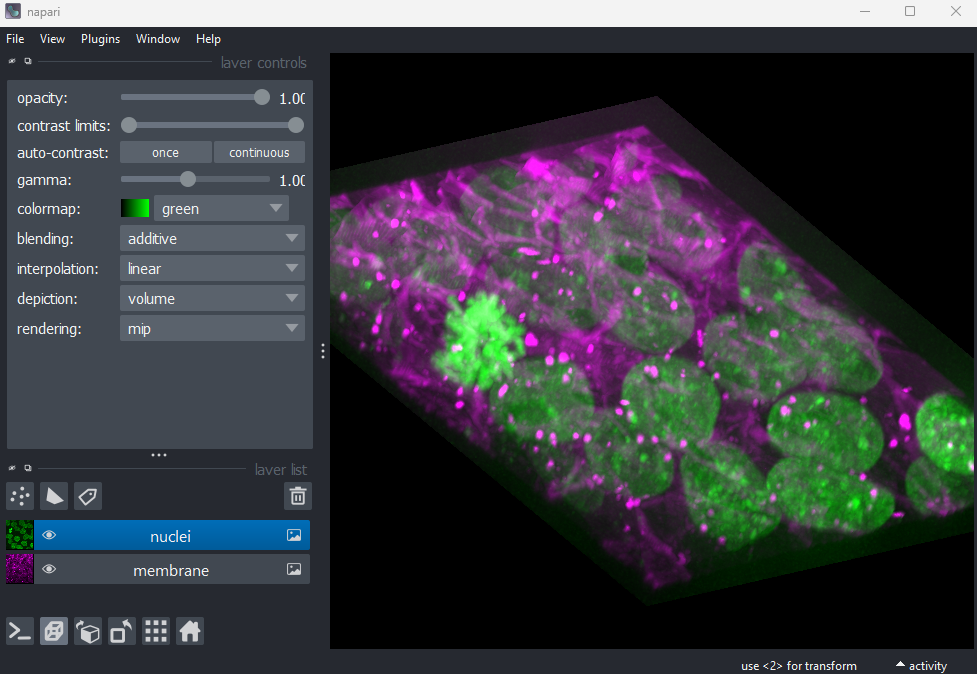
The controls for moving in 3D are similar to those for 2D:
Rotate - Click and drag
Pan - Shift + click and drag
Zoom - Scroll in/out
Roll dimensions 
This changes which image dimensions are displayed in the viewer. For example, let’s switch back to the 2D view for our cells image and press the roll dimensions button multiple times. You’ll see that it switches between different orthogonal views (i.e. at 90 degrees to our starting view). Pressing it 3 times will bring us back to the original orientation.
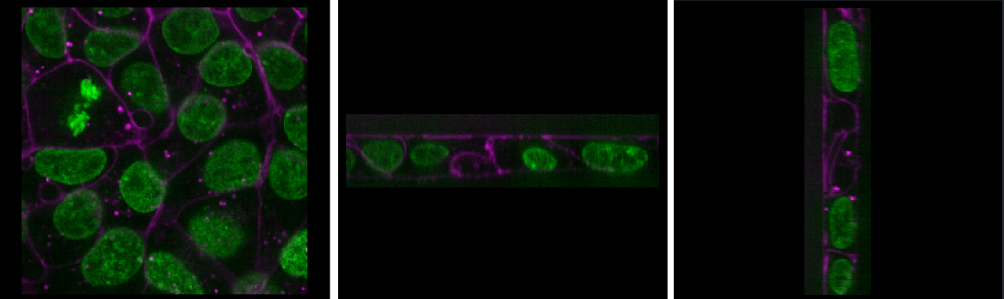
Transpose dimensions 
This button swaps the two currently displayed dimensions. In our cells image, this means the x and y axis are switched. Pressing the button again brings us back to the original orientation.
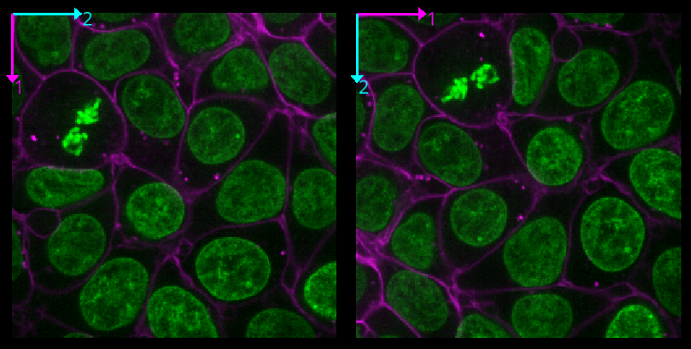
Grid 
This button displays all image layers in a grid (+ any additional layer types, as we’ll see later in the episode). Using this for our cells image, we see the nuclei (green) displayed next to the cell membranes (purple), rather than on top of each other.

Layer list
Now that we’ve seen the main controls for the viewer, let’s look at
the layer list. ‘Layers’ are how Napari displays multiple items together
in the viewer. For example, currently our layer list contains two items
- ‘nuclei’ and ‘membrane’. These are both Image layers and
are displayed in order, with the nuclei on top and membrane
underneath.
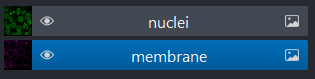
We can show/hide each layer by clicking the eye icon on the left side of their row. We can also rename them by double clicking on the row.
We can change the order of layers by dragging and dropping items in the layer list. For example, try dragging the membrane layer above the nuclei. You should see the nuclei disappear from the viewer (as they are now hidden by the membrane image on top).
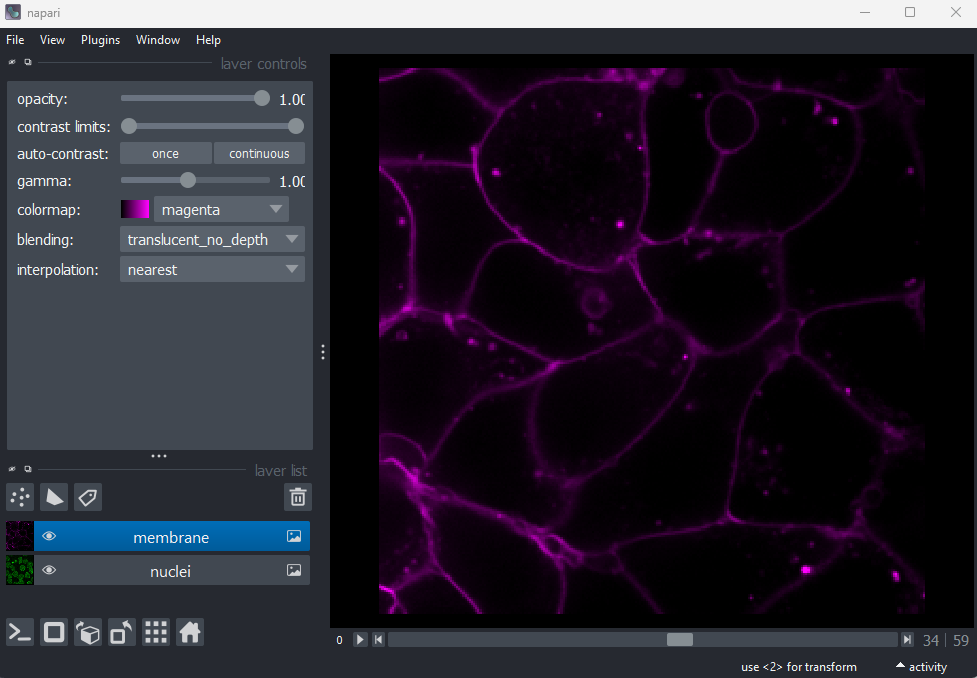
Here we only have Image layers, but there are many more
types like Points, Shapes and
Labels, some of which we will see later in the episode.
Layer controls
There is a lot more information here that we have time for during the session so I would suggest going through these elements very briefly and/or skipping altogether. If they want to look at the challenges themselves after we can point that we will have them.
Next let’s look at the layer controls - this area shows controls only
for the currently selected layer (i.e. the one that is highlighted in
blue in the layer list). For example, if we click on the nuclei layer
then we can see a colormap of green, while if we click on
the membrane layer we see a colormap of magenta.
Controls will also vary depending on layer type (like
Image vs Points) as we will see later in this episode.
Let’s take a quick look at some of the main image layer controls:
Opacity
This changes the opacity of the layer - lower values are more transparent. For example, reducing the opacity of the membrane layer (if it is still on top of the nuclei), allows us to see the nuclei again.
Contrast limits
The contrast limits adjust what parts of the image we can see and how bright they appear in the viewer. Moving the left node adjusts what is shown as fully black, while moving the right node adjusts what is shown as fully bright.
Colormap
Along with the contrast limits, the colormap determines how pixels values are assigned colors on the display. Clicking in the dropdown shows a wide range of options that you can swap between.
Blending
This controls how multiple layers are blended together to give the final result in the viewer. There are many different options to choose from. For example, let’s put the nuclei layer back on top of the membrane and change its blending to ‘opaque’. You should see that it now completely hides the membrane layer underneath. Changing the blending back to ‘additive’ will allow both the nucleus and membrane layers to be seen together again.
Using image layer controls
Adjust the layer controls for both nuclei and membrane to give the result below:
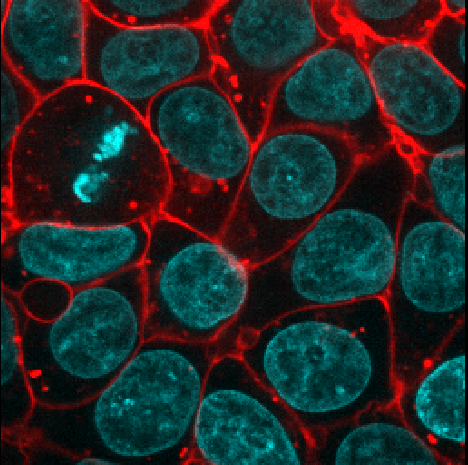
- Click on the nuclei in the layer list
- Change the colormap to cyan
- Click on the membrane in the layer list
- Change the colormap to red
- Move the right contrast limits node to the left to make the membranes appear brighter
Layer buttons
Mention that layers can be made up of different objects depending on what they represent. We are looking at an image but could annotate with points/shapes, and we will make a labels layer in our segmentations in a later episode.
So far we have only looked at Image layers, but there
are many more types supported by Napari. The layer buttons allow us to
add additional layers of these new types:
Points 
This button creates a new points layer. This can be used to mark specific locations in an image.
Shapes 
This button creates a new shapes layer. Shapes can be used to mark regions of interest e.g. with rectangles, ellipses or lines.
Labels 
This button creates a new labels layer. This is usually used to label specific regions in an image e.g. to label individual nuclei.
Remove layer 
This button removes the currently selected layer (highlighted in blue) from the layer list.
Point layers
Let’s take a quick look at one of these new layer types - the
Points layer.
Add a new points layer by clicking the points button. Investigate the different layer controls - what do they do? Note that hovering over buttons will usually show a summary tooltip.
Add points and adjust settings to give the result below:
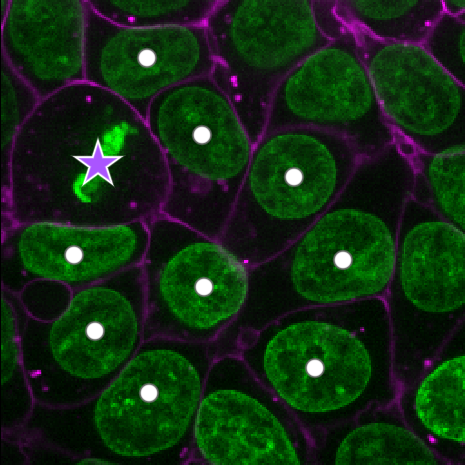
- Click the ‘add points’ button

- Click on nuclei to add points on top of them
- Click the ‘select points’ button

- Click on the point over the dividing nucleus
- Increase the point size slider
- Change its symbol to star
- Change its face colour to purple
- change its edge colour to white
Napari plugins
Explain that they will not be able to see the plugin explorer due to an issue where the micro-sam plugin seems to disable search for plugins through napari. Use a conda environment, tell them we have put alternative instructions to install in case you want to explore plugins but many would be available to install at command line, so we will go to napari-hub and show plugins page saying that this is what it looks like in case you want to try out later.
How can we quickly assess the pixel values in an image? We could hover over individual pixels in the Napari window, or we could print the array into Napari’s console or in a Jupyter notebook, but these are hard to interpret at a glance. A much better option is to use an image histogram.
To do this, we will have to install a new plugin for Napari. Remember from the Imaging Software episode that plugins add new features to a piece of software. Napari has hundreds of plugins available on the napari hub website.
Let’s start by going to the napari hub and searching for ‘matplotlib’:
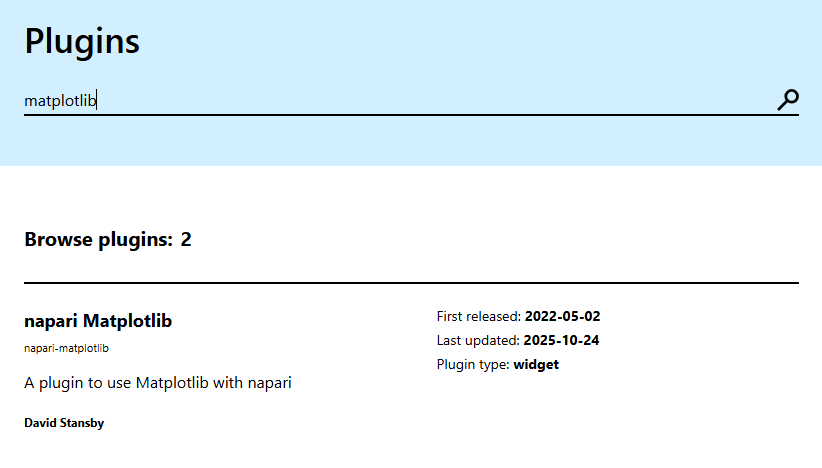
You should see ‘napari Matplotlib’ appear in the list (if not, try
scrolling further down the page). If we click on
napari matplotlib this opens a summary of the plugin with
links to the documentation and github repository containing the plugin’s
source code.
Now that we’ve found the plugin we want to use, let’s go ahead and
install it in Napari. Note that some plugins have special requirements
for installation, so it’s always worth checking their napari hub page
for any extra instructions. In the top menu bar of Napari select:Plugins > Install/Uninstall Plugins...
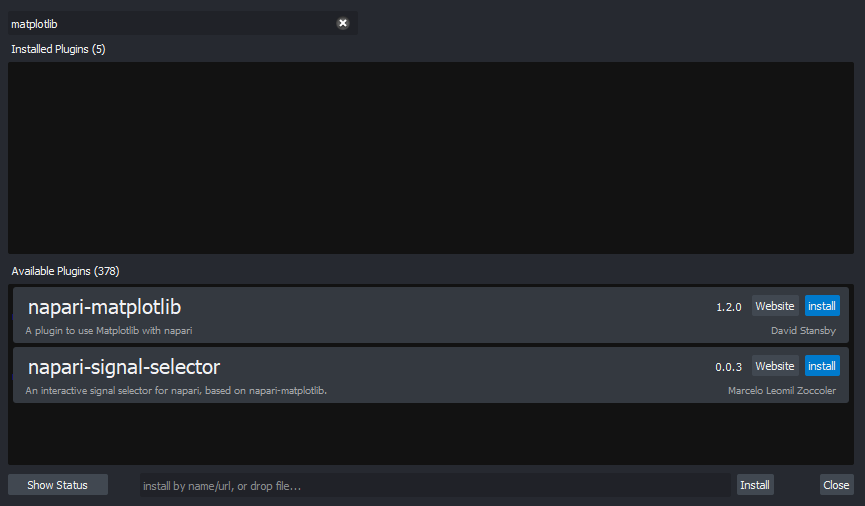
This should open a window summarising all installed plugins (at the top) and all available plugins to install (at the bottom). If we search for ‘matplotlib’ in the top searchbar, then ‘napari-matplotlib’ will appear under ‘Available Plugins’. Press the blue install button and wait for it to finish. You’ll then need to close and re-open Napari.
If all worked as planned, you should see a new option in the top
menubar under:Plugins > napari Matplotlib
This section is good just to touch upon what to consider when looking at plugins. We won’t have time to do the challenge.
Finding plugins
Napari hub contains hundreds of plugins with varying quality, written by many different developers. It can be difficult to choose which plugins to use!
- Search for cell tracking plugins on Napari hub
- Look at some of the plugin summaries, documentation and github repositories
- What factors could help you decide if the plugin is well maintained?
- What factors could help you decide if the plugin is popular with Napari users?
Is a plugin well maintained?
Some factors to look for:
Last updated
Check when the plugin was last updated - was it recently? This is shown
in the search list summary and in the left sidebar when you open the
plugin’s page on napari-hub.
Documentation
Is the plugin summary (+ any linked documentation) detailed enough to
explain how to use the plugin?
Is a plugin popular?
Some factors to look for:
Stars on github
If you open a plugin’s linked github repository, you can see the number
of ‘stars’ in the top right. More stars tend to indicate a plugin is
more popular - although this isn’t always the case! Github is mainly
used by plugin developers, so a plugin with few stars may still have
many people using it.
Image.sc
It can also be useful to search the plugin’s name on the image.sc forum to browse relevant
posts and see if other people had good experiences using it. Image.sc is
also a great place to get help and advice from other plugin users, or
the plugin’s developers.
- Napari’s user interface is split into a few main sections including the canvas, layer list, layer controls…
- Layers can be of different types e.g.
Image,Point,Label - Different layer types have different layer controls
- Lots of additional functionality for Napari are available through plugins extendng its capability.